(Week 43, 2002, 21 Oct - 27 Oct.)
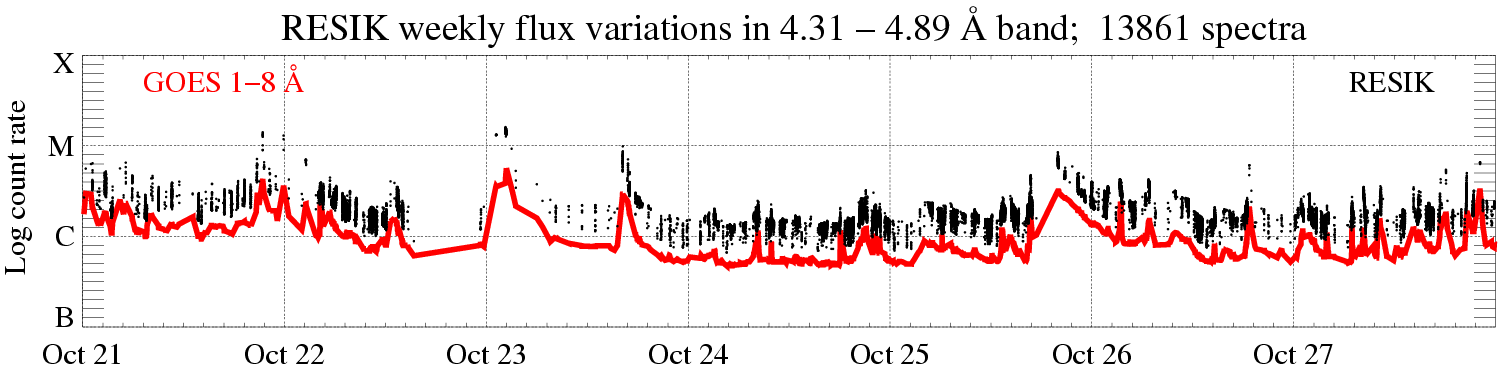
In the display above (click to enlarge), the solar X-ray fluence seen by RESIK (black points) is plotted atop GOES red line. Only periods with good spectral measurements are indicated. The total number of good spectral measurements is given in the title line.
| New mode exercise: | Lower HV Settings (LHVS) Oct 23 04:01 - Oct 23 10:00:00 (dumps: 06854, 06855) | |||||
| Calibration : | Amplitude Disctiminator Scans (ADS) between: Oct 22 22:01:47 UT - Oct 23 03:59:53 UT (dump: 06854 ) HVA=standard-4 (1358V), HVB= standard-3 (1328 V) | |||||
| ADS Settings: | ADS settings used are presented below, otherwise previous settings have been used (see Weekly_42): | |||||
 |
||||||
|
Channel |
l Band | ADS | ||||
| #1 | #2 | 3.37 - 3.88 Å : 35 - 85 | ||||
| #2 | #0 | 3.82 - 4.33 Å : 70 - 120 | ||||
| #3 | #3 | 4.31 - 4.89 Å : 55 - 110 | ||||
| #4 | #1 | 4.96 - 6.09 Å : 90 - 160 | ||||
|
|
|
software indexes | ||||
| spectroscopic notation (papers) | ||||||
Remarks: COMP
on-board computer returned from backup unit to primary, after software reset.
Observing time lost due to
programme upload: ~104 s
Timing of the observations & Dynamic DGI
RESIK measurements are organized according to the basic data gather interval (DGI). At present DGI = 2 s, but can assume by command any value from 0.5 s (yet untested) up to hundreds of seconds. In each DGI, the following informations are being collected:
Synchronous to DGI
All, in-window & encoded counts (to be explained in more detailsf in one of the future Weekly News) in each of the four detectors (physically two separate double detectors A & B)
Pulse height analysis (PHA) 32-bin histograms of all counts in a given detector. These measurements are commuted for all four detectors each DGI, so, in each fourth time interval the same detector PHA is recorded.
Technical info containing high voltage (HV) settings on each of detectors A & B.
ADS in-window settings for each channel separately
PIN - diode detector radiation environment readouts, commuted between four separate sensors.
Asynchronous to DGI (at the end of DGI)
All, in-window & encoded RATES as determined from the 0.248 s interval, closest in time to the end of each DGI
Temperature readouts for 14 sensors placed in different parts of the spectrometer
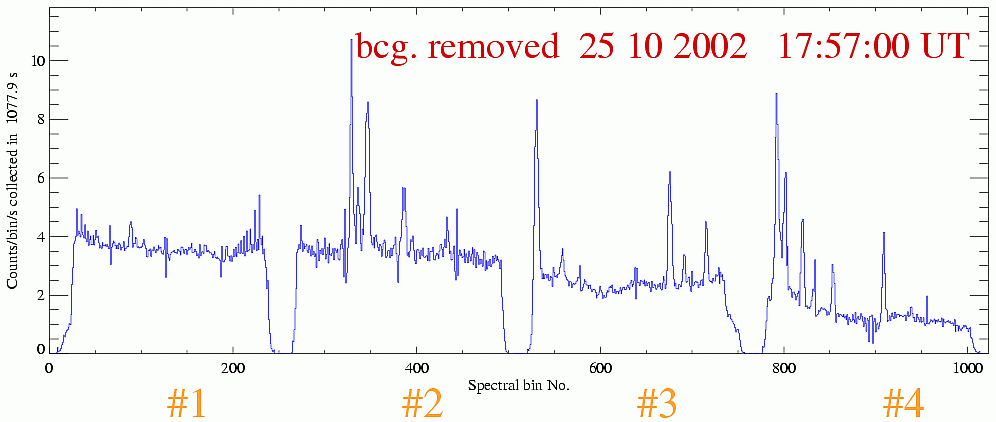
Spectra (in 4 channels, 256 position bins in each channel) containing only the encounted events are stored to telemetry using the dynamic DGI allocation scheme (dDGI). The duration of dDGI is a multiple of basic DGI. Its lenght depends on the counts being collected at any given instant in the previous DGI. If the upper limit (set at present as 10 000 cts, summed over four detectors) is not reached in a given DGI, the spectral signal is being summed further, until limit is reached. Nothwithstanding, if limit is still not reached after certain time (now 5 min) spectra are being sent to telemetry anyway.
With this scheme, we integrate spectra up to 5 min onboard in case of low solar X-ray activity, and decrease dDGI down to 2 s in case of strong (> M5) flares.
By adopting this dDGI scheme, we save a lot of telemetry and are able to make observations during all periods available for the measurements, increasing the time resolution automatically for intense flares.
How it works? Below is an example illustrating changing dDGI scheme during the flare on 20 September 2002 (~05:17UT, M1.5 S24E78) (http://www.cbk.pan.wroc.pl/2002/RDC_200209/resik_prC_06350_20020920_0307.png).
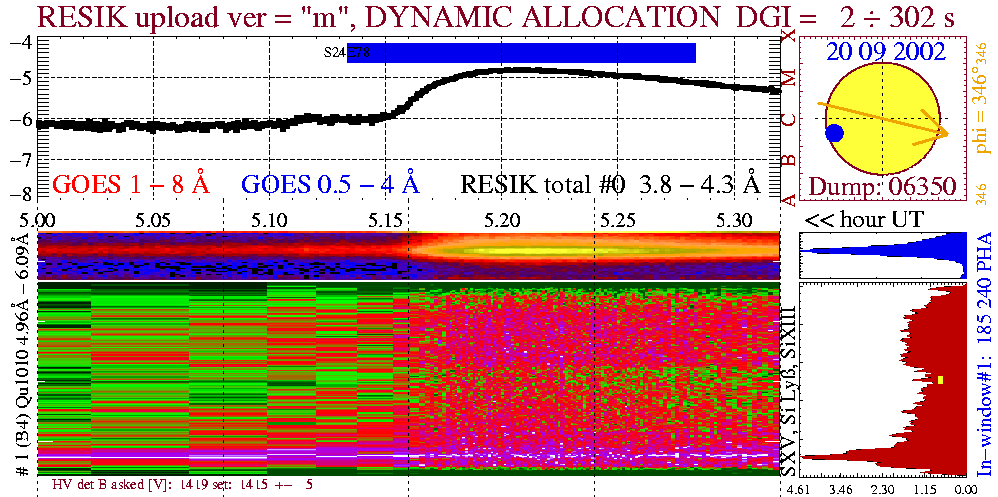
In the upper plot, time variations of all counts in RESIK #2 (containing Ar XVII triplet) are plotted in black. At the bottom, the spectra measured in channel #4 (sulfur & silicon lines) are shown in a two-dimensional plot, where time runs towards the right and the wavelenght upwards. (More detailed explanations of the figure will follow soon).
It is directly seen how the dDGI scheme works as the spectra gather interval visibly shortens (from 300 s to 4 s) during flare rise phase. The strong line at the bottom is S XV w He-like triplet line.
Report prepared by: Janusz Sylwester js@cbk.pan.wroc.pl
The report presented has been done in "real time" and so it may
contain jargon, blunders, or trivialities. We do not have also an English native
speaker in our Wroclaw group! We would be happy to discuss problems mentioned
above in more details if necessary.
RESIK data are in the open public domain and can be requested from: http://surfwww.mssl.ucl.ac.uk/surf/data_request.html.
Page made on 23 October 2002 by: Jarek Bakala jb@cbk.pan.wroc.pl