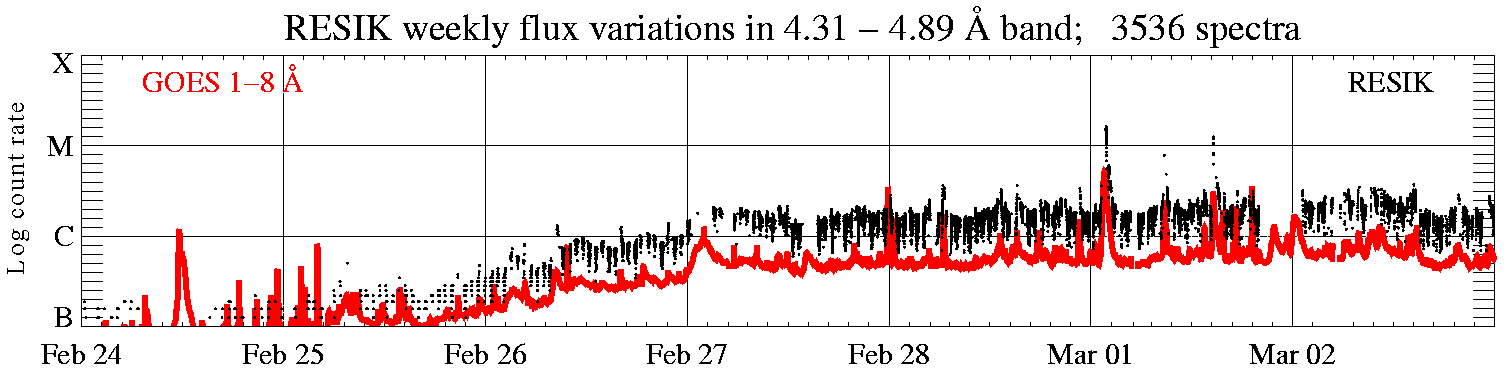
(Week 09, 2003, 24 Feb. - 02 Mar.)
In the display above (click to enlarge), the solar X-ray fluence seen by RESIK (black points) is plotted atop GOES red line. Only periods with good spectral measurements are indicated. The total number of good spectral measurements is given in the title line.
|
Operation mode: |
Since 08 February 2003 the DGI rate has been set to 4 s. '3rd order reflections' (ORD3) is used as stand by mode. 3rd order measurements are indicated on the main catalogue page http://www.cbk.pan.wroc.pl/resik_catalogue.htm (cf. green boxes).
|
|
|
Calibrations made: |
No calibrations made
| |
|
ADS Settings: |
||
|
| ||
| (ORD1) HV: Det. A - 1450 V, Det. B - 1419 V. | (ORD3) HV: Det. A - 1389 V, Det. B - 1328 V. | ||||||
|
Channel |
l Band |
ADS |
Channel |
l Band |
ADS | ||
| #1 | #2 | 3.37 - 3.88 Å | 55 - 110 | #1 | #2 | 1.16 - 1.29 Å | 110 - 230 |
| #2 | #0 | 3.82 - 4.33 Å | 80 - 165 | #2 | #0 | 1.27 - 1.44 Å | 110 - 230 |
| #3 | #3 | 4.31 - 4.89 Å | 90 - 160 | #3 | #3 | 1.44 - 1.63 Å | 110 - 230 |
| #4 | #1 | 4.96 - 6.09 Å | 135 - 200 | #4 | #1 | 1.65 - 2.03 Å | 140 - 230 |
|
|
| ||||||
Data gaps due to missing telemetry: ~ 16.8 h.
Note, that the link to the catalogue page is now: http://www.cbk.pan.wroc.pl/resik_catalogue.htm.
Solar Flare Abundances of Potassium, Argon, and Sulphur
From some analysis carried out on RESIK spectra during long-duration flares involving JS, BS and KJHP, we have found that the coronal abundance of potassium (K) is at least an order of magnitude higher than the photospheric abundance. This is the first time the coronal abundance of potassium has ever been made, and with its extremely low value of first ionization potential (FIP), this result will be of interest to those who have written extensively about the FIP bias of abundances (i.e. low-FIP elements relatively abundant in the corona, high-FIP elements either the same as photospheric or depleted).
As previous RESIK and Diogeness Weekly News bulletins have indicated, RESIK has seen a large number of flares with spectra having impressively intense K XVIII lines. The lines are due to 1s2 - 1s2l (l=s, p) transitions, wavelengths 3.53 - 3.57 Å, and are seen in RESIK channel 1 (in the convention used in the RESIK paper by Sylwester et al., ESA SP-506, vol. 2, pp. 765 - 768, 2002). Nearby in this same channel is the Ar XVIII Lyα doublet, wavelength 3.73 Å which has a contribution function that peaks at a higher temperature than the K XVIII lines. Despite the nominally very low abundance of K, it normally turns out that the K XVIII lines are more prominent than the Ar XVIII line unless the flare is extremely hot.
We have been working on abundances of K, Ar, and S derived from spectra during a number of long-duration events and are now working on a paper to be submitted to ApJ (Letters). At some stage in each of these events, RHESSI was operating so there are hard X-ray data available as well. From our analysis of these RESIK flare data, it appears that the K abundance in the flare plasma, presumed coronal in origin, is much higher, by a factor between 13 and 30, than the photospheric abundance. There are indications that the Ar and S abundances are within a factor of about 2 of those listed in Feldman et al.'s papers (1992 Phys. Scripta etc.).
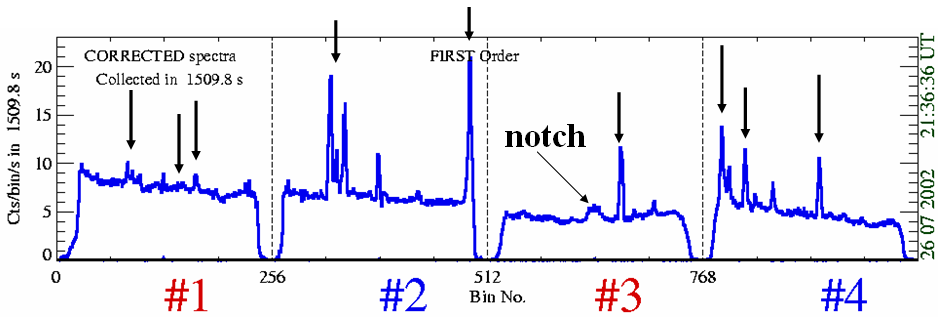
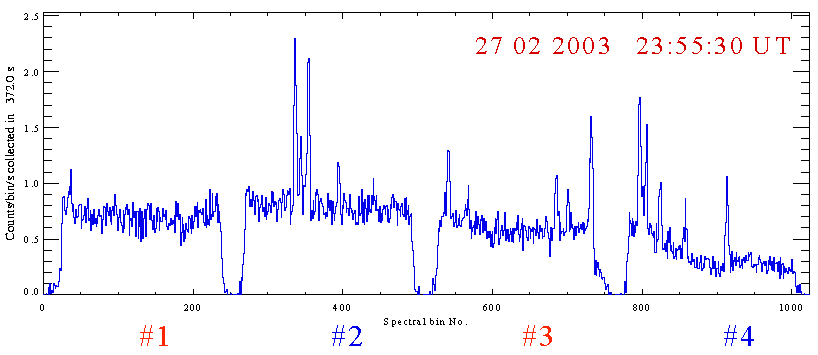
Figure 1. Spectra in RESIK channels 1 - 4, peak of July 26, 2002 flare (22:04 UT). Channel 1 shows K XVIII lines (3.53 - 3.57 Å), Ar XVIII line (3.73 Å) and also S XVI 1s - 5p line (3.69 Å). These lines give K:Ar:S abundance ratios. Ar XVII and S XV lines in channel 2 give Ar:S abundance ratio which is confirmed by channel 1 spectra. It would appear that there is real continuum in this channel, so absolute abundance measurements are possible. The flare was disposed on the Sun such that the S XV 1s2 - 1s3p line just appears in channel 2. S XVI Lyα appears in channel 3 with notch (non-solar feature) while S XV, Si XIV and Si XIII lines appear in channel 4.
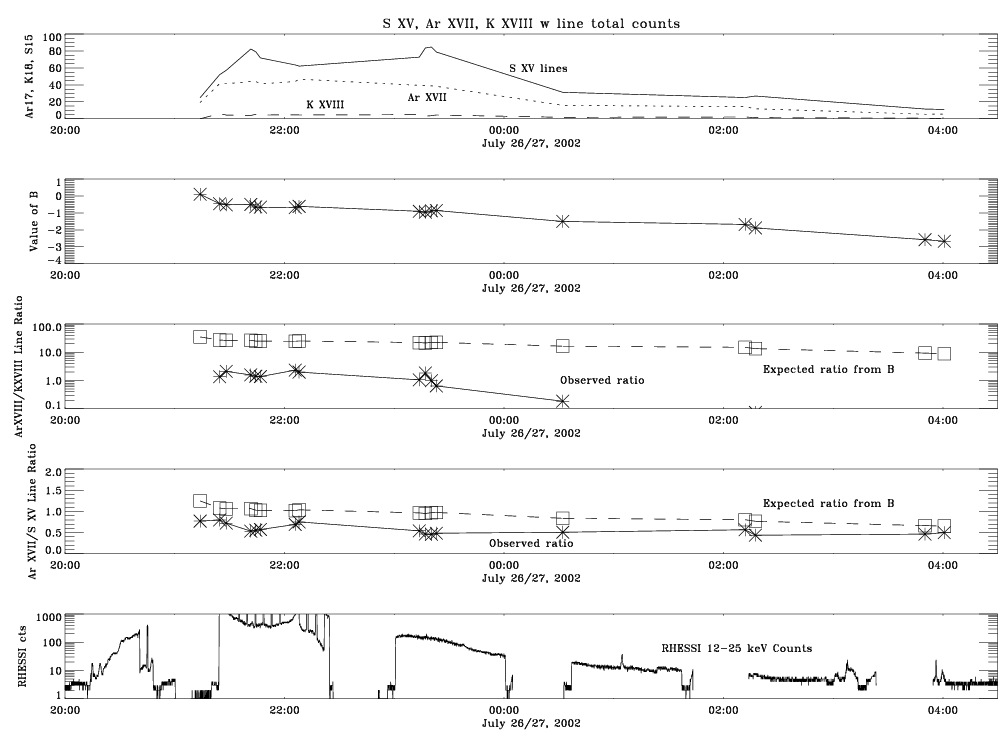
Figure 2. July 26/27, 2002 long-duration flare. Top panel: Lightcurves of S XV (4.30, 4.09 Å), Ar XVII (3.95 Å), K XVIII (3.53 Å). Second panel: Variation of differential emission measure (DEM) during the flare measured from Si XIII/Si XIV line ratio: DEM = const. x TB (T = temperature). Third panel: Expected (squares) and observed (stars) Ar XVIII/K XVIII line ratios; observed are less by up to factor 20, implying coronal abundance of K is 20 times photospheric. Fourth panel: Expected and observed Ar XVII/S XV line ratio (linear scale), implying Ar/S abundance ratio is a little less than in Feldman et al.Fifth (bottom) panel: RHESSI light-curve for 12 - 25 keV.
The Fe line complex (Fe XXV, Fe XXIV and other ion satellites, Fe XXVI lines)
are seen as a single peak in RHESSI spectra. We propose working on the absolute
abundance of Fe from RHESSI using occasions when RESIK sees the Fe XXV lines in
3rd order. This should give added confidence on the above results for K, Ar, and
S.
Prepared by: Ken Phillips phillips@stars.gsfc.nasa.gov, Janusz Sylwester js@cbk.pan.wroc.pl, Barbara Sylwester bs@cbk.pan.wroc.pl, and Brian Dennis Brian.R.Dennis.1@gsfc.nasa.gov
We would be happy to discuss problems mentioned above in
more details if necessary.
RESIK data are in the open public domain and
can be requested from: http://surfwww.mssl.ucl.ac.uk/surf/data_request.html.
Previous RESIK_weekly notes are in the archive: http://www.cbk.pan.wroc.pl/resik_archive.htm
Page made on 07 March 2003 by: Anna Kepa ak@cbk.pan.wroc.pl and Jarek Bakala jb@cbk.pan.wroc.pl