(Week 48, 2002, 25 Nov. - 01 Dec.)
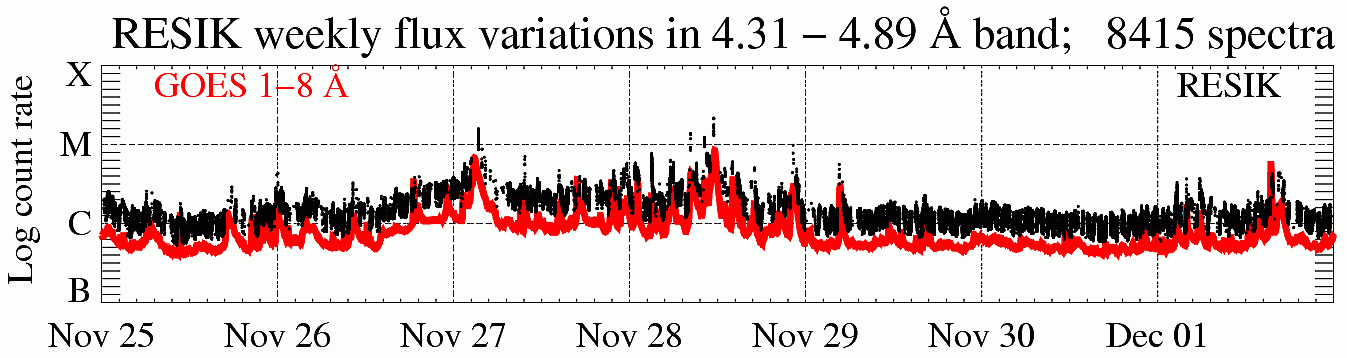
In the display above (click to enlarge), the solar X-ray fluence seen by RESIK (black points) is plotted atop GOES red line. Only periods with good spectral measurements are indicated. The total number of good spectral measurements is given in the title line.
| New mode: | The '3rd order reflections'
(ORD3) operating mode is used as a new 'standard' mode. More detailed description will be given next week. Other than (ORD3) settings are given below |
|||||
| Calibrations made: |
No calibrations made | |||||
| ADS Settings: | HV: Det. A - 1450 V, Det. B - 1389 V. ADS are below. | |||||
 |
||||||
|
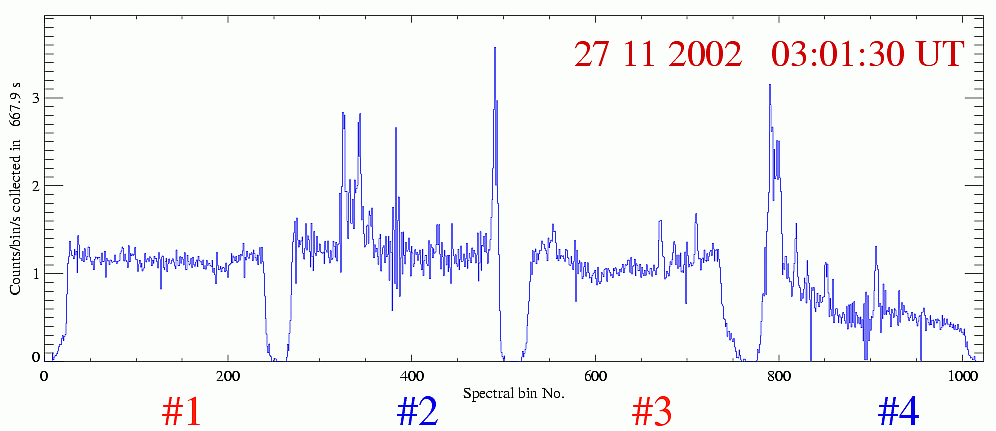
Channel |
l Band | ADS | ||||
| #1 | #2 | 3.37 - 3.88 Å : 35 - 85 | ||||
| #2 | #0 | 3.82 - 4.33 Å : 70 - 120 | ||||
| #3 | #3 | 4.31 - 4.89 Å : 55 - 110 | ||||
| #4 | #1 | 4.96 - 6.09 Å : 90 - 160 | ||||
|
|
|
software indexes | ||||
| spectroscopic notation (papers) | ||||||
Data gaps due to missing telemetry: ~10 seconds.
Forthcoming Solar Eclipse on 4th December 2002
as seen from CORONAS-F
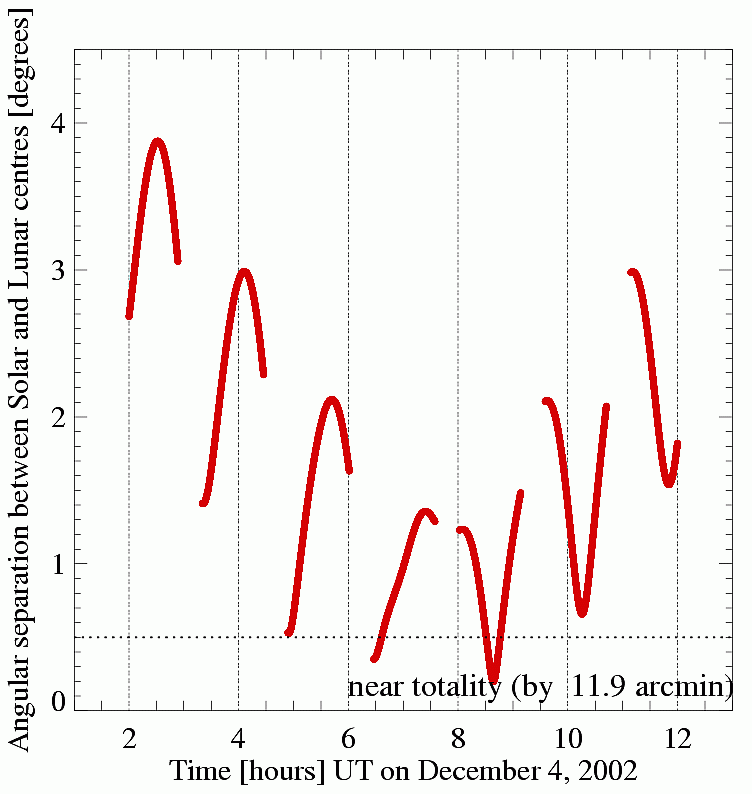
This plot shows the variation of an angular separation between the Moon and the Sun centres
as seen from the CORONAS-F satellite. It was constructed based on Zbigniew Kordylewski calculations from the CORONAS-F orbital ephemeris of Dec. 4, 2002.
The red heavy line plotted shows periods when CORONAS-F is outside the Earth's shadow. The horizontal dotted
line is plotted at the level corresponding to the sum of the solar and lunar
radii. Thus every point below corresponds to a partial eclipse.
The angular separation does not get to zero on this date (the minimum separation
being ~12 arcmin), so CORONAS-F will miss a total eclipse, even though it gets four partial ones.
The
first eclipse period will be seen somewhat eastward from Brazil towards
the Antarctica.
During this period the SAA radiation anomaly may cause RESIK detectors being
switched-OFF. At the time of the deepest eclipse around 08:40 UT, the satellite will be
travelling from Antarctica towards Australia and China.
Report prepared by: Zbigniew Kordylewski zk@cbk.pan.wroc.pl
The report presented has been done in "real time" and so it may
contain jargon, blunders, or trivialities. We do not have also an English native
speaker in our Wroclaw group! We would be happy to discuss problems mentioned
above in more details if necessary.
RESIK data are in the open public domain and can be requested from: http://surfwww.mssl.ucl.ac.uk/surf/data_request.html.
Previous RESIK_weekly notes are in the
archive:
http://www.cbk.pan.wroc.pl/resik_archive.htm
Page made on 28November 2002 by: Jarek Bakala jb@cbk.pan.wroc.pl