(Week 05, 2003, 27 Jan. - 02 Feb.)
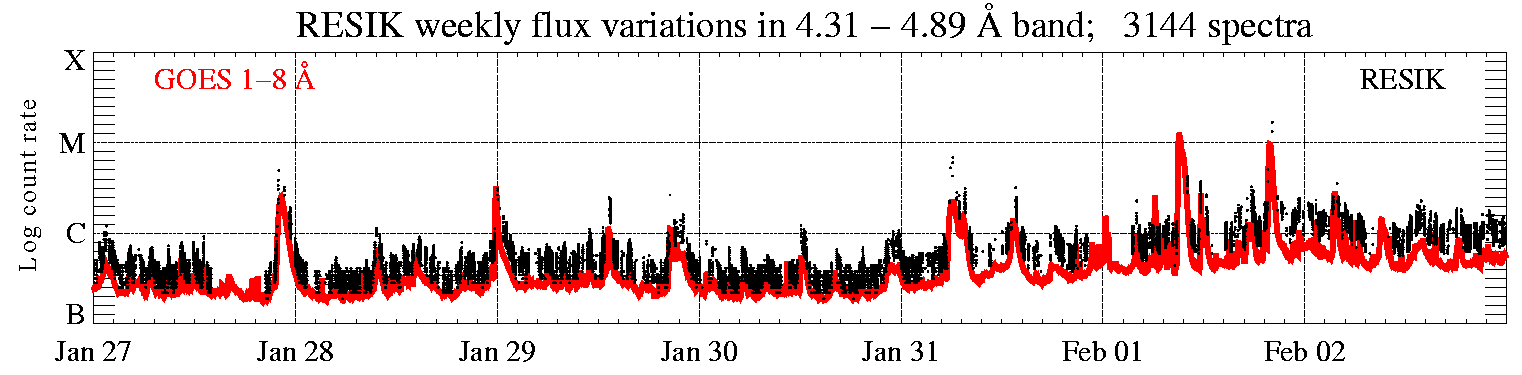
In the display above (click to enlarge), the solar X-ray fluence seen by RESIK (black points) is plotted atop GOES red line. Only periods with good spectral measurements are indicated. The total number of good spectral measurements is given in the title line.
|
Operation mode: |
'3rd order
reflections' (ORD3) is used as stand-by mode. 3rd order measurements are indicated on the main catalogue page http://www.cbk.pan.wroc.pl/resik_catalogue.htm (cf. green boxes).
|
|
|
Calibrations made: |
No calibrations made
| |
|
ADS Settings: |
||
|
| ||
| (ORD1) HV: Det. A - 1450 V, Det. B - 1419 V. | (ORD3) HV: Det. A - 1389 V, Det. B - 1328 V. | ||||||
|
Channel |
l Band |
ADS |
Channel |
l Band |
ADS | ||
| #1 | #2 | 3.37 - 3.88 Å | 55 - 110 | #1 | #2 | 1.16 - 1.29 Å | 110 - 230 |
| #2 | #0 | 3.82 - 4.33 Å | 80 - 165 | #2 | #0 | 1.27 - 1.44 Å | 110 - 230 |
| #3 | #3 | 4.31 - 4.89 Å | 90 - 160 | #3 | #3 | 1.44 - 1.63 Å | 110 - 230 |
| #4 | #1 | 4.96 - 6.09 Å | 135 - 200 | #4 | #1 | 1.65 - 2.03 Å | 140 - 230 |
|
|
|||||||
Data gaps due to missing telemetry: ~ 7.80 h.
Note, that the link to the catalogue page is now: http://www.cbk.pan.wroc.pl/resik_catalogue.htm.
Faint, Slowly Evolving Flare on 27 Jan. 2003
In spite of rather low solar X-ray activity seen recently, a number of isolated small flares took place. Here, as an example, we present the observations of a small, disc flare (S17W24) on 27th January 2003. The flare started at 21:42:00 UT, reached the maximum at 22:19:20 UT and ended at 22:50:00 UT. This was an event of C2.4 GOES importance.
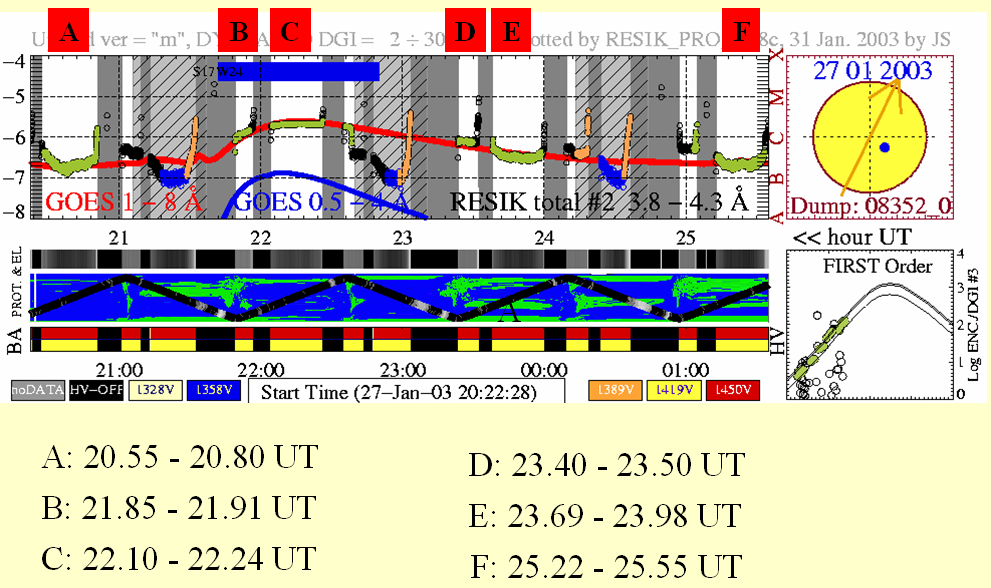
Figure 1. The part of RESIK catalogue page covering the times when the presented flare took place. The letters (A, B,..., F) correspond to six selected intervals for which the spectra have been time-integrated (see next Figure).
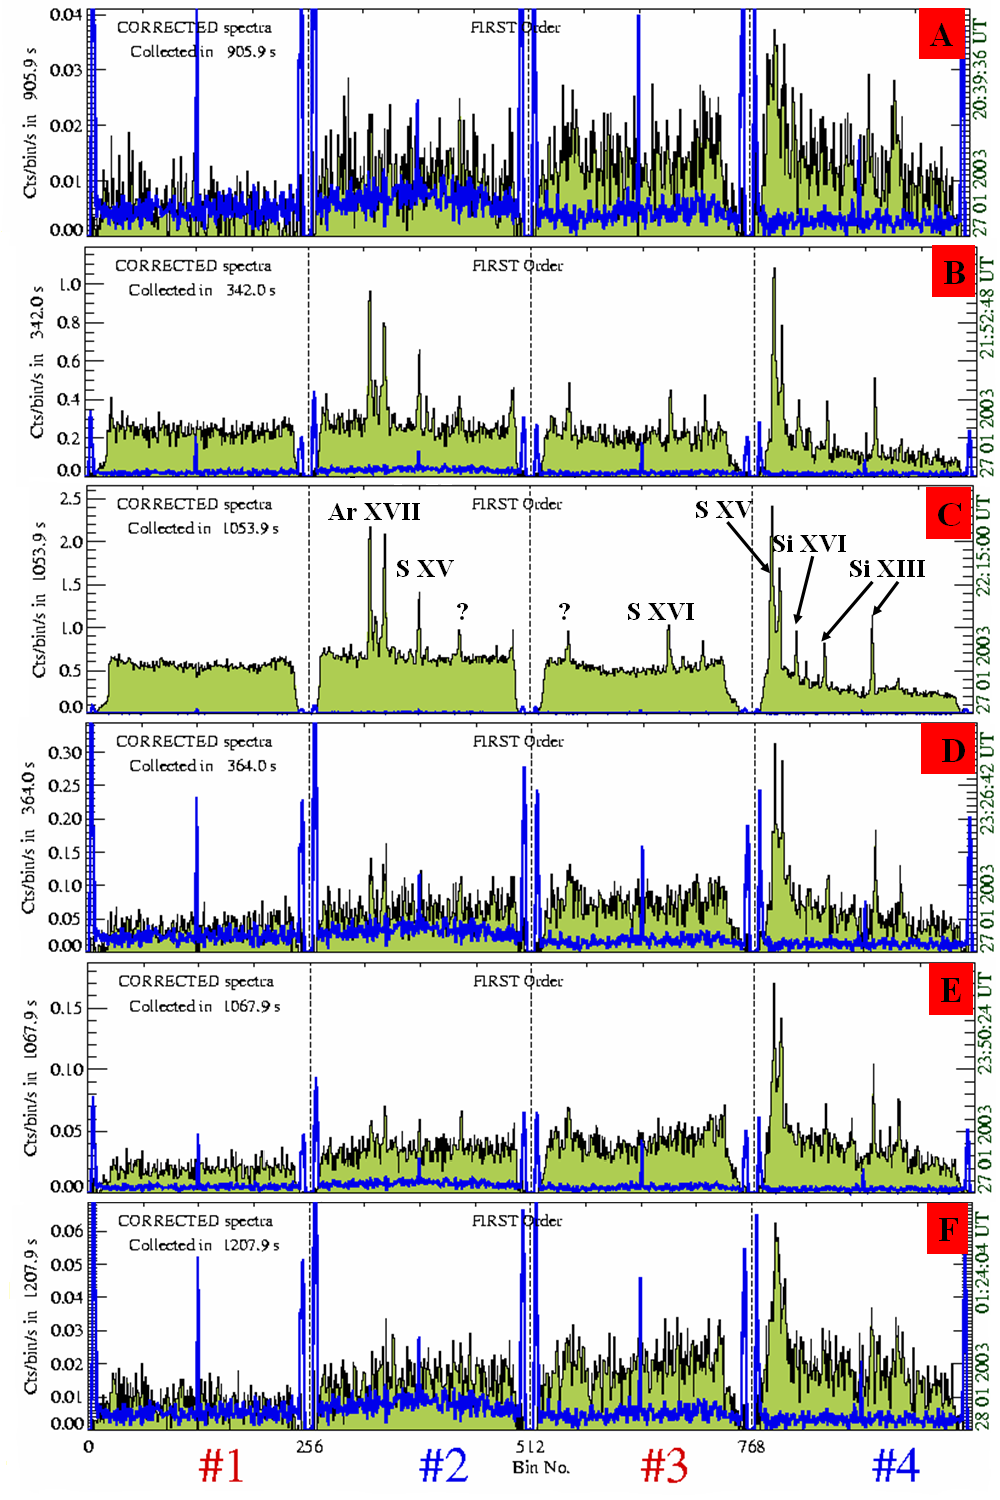
Figure 2. The time-integrated spectra (in cts/bin/s) measured during the consecutive phase of this flare development are presented (from preflare - A, to postflare - F). In the left column of each panel the integration times are given. One can notice that the spectra are rather noisy apart from the maximum (C) when the statistics is good enough. Indicated are the ions responsible for some of the prominent lines observed. For the details of line identification see Weekly#40, W40, 2002.
The inspection of presented spectra indicates that the lines are absent or hidden in the noise for channel #1 (3.37 Å 3.88 Å). For the other, hotter, and/or bigger flares the K XVIII triplet and the Ar XVIII Lyα lines are seen in this channel. However even for this small event, the S XVI Lyα line is well resolved together with its satellites. This Lyα line is pronounced during the flare rise and maximum phases (B & C) only. There is a number of identified lines is channel #2 and #4 which are important for the flare plasma diagnostics. However we are still missing the identification of some prominent features (with ?). We hope to make this identifications soon.
Report prepared by: Barbara Sylwester bs@cbk.pan.wroc.pl and Janusz Sylwester js@cbk.pan.wroc.pl.
The report presented has been done in "real time" and so it may contain
jargon, blunders, or trivialities. We do not have also an English native speaker
in our Wroclaw group! We would be happy to discuss problems mentioned above in
more details if necessary.
RESIK data are in the open public domain and
can be requested from: http://surfwww.mssl.ucl.ac.uk/surf/data_request.html.
Previous RESIK_weekly notes are in the archive: http://www.cbk.pan.wroc.pl/resik_archive.htm
Page made on 7 February 2003 by: Anna Kepa ak@cbk.pan.wroc.pl and Jarek Bakala jb@cbk.pan.wroc.pl