![]()
RESIK & Diogeness NEWS
|
|
(Week 18, 2003, 28 Apr. - 04 May.)
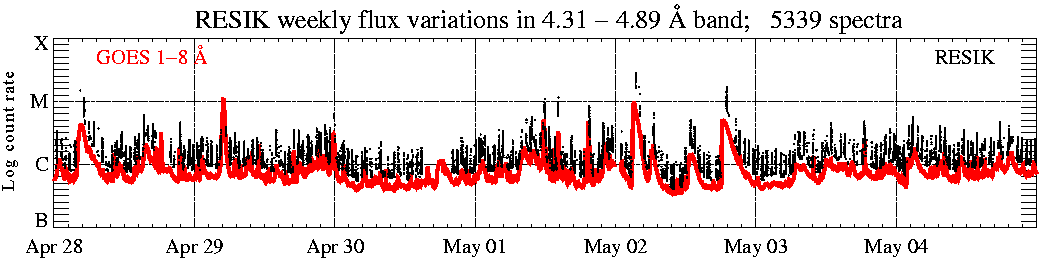
In the display above (click to enlarge), the solar X-ray fluence seen by RESIK (black points) is plotted atop GOES red line. Only periods with good spectral measurements are indicated. The total number of good spectral measurements is given in the title line.
|
Operation mode: |
1 s DGI has been used '3rd order reflections' (ORD3) is
used as stand-by mode.
|
|
|
Calibrations made: |
No calibrations made
| |
|
ADS Settings: |
| |
|
| ||
| (ORD1) HV: Det. A - 1480 V, Det. B - 1419 V. | (ORD3) HV: Det. A - 1389 V, Det. B - 1328 V. | ||||||
|
Channel |
l Band |
ADS |
Channel |
l Band |
ADS | ||
| #1 | #2 | 3.37 - 3.88 Å | 115 - 195 | #1 | #2 | 1.16 - 1.29 Å | 110 - 230 |
| #2 | #0 | 3.82 - 4.33 Å | 75 - 170 | #2 | #0 | 1.27 - 1.44 Å | 110 - 230 |
| #3 | #3 | 4.31 - 4.89 Å | 170 - 250 | #3 | #3 | 1.44 - 1.63 Å | 110 - 230 |
| #4 | #1 | 4.96 - 6.09 Å | 145 - 205 | #4 | #1 | 1.65 - 2.03 Å | 140 - 230 |
|
|
| ||||||
Data gaps due to missing telemetry: ~ 9.5 h.
Note, that the link to the catalogue page is now: http://www.cbk.pan.wroc.pl/resik_catalogue.htm.
9 April 2003 Flare
Despite the fact that the solar activity is coming down, we have recorded recently several interesting events. Among them, the M2.5, 1F, (S10W78) flare on 9 April 2003 happened to be particularly well observed by RESIK. This is illustrated in Figure 1 (upper part of the Catalogue page). The flare is characterized by a steep rise phase (~5min), and relatively long decay (~4.5 hours).

A: 23:10:48 - 23:27:00 UT (pre-flare), B: 23:26:42 - 23:28:12 UT (steep rise), C: 23:28:08 - 23:34:12 UT (max), D: 23:39:36 - 23:45:36 UT (decay), E: 00:45:00 - 01:01:12 UT (decay), F: 02:16:48 - 02:33:00 UT (late dacay), G: 03:51:00 - 04:09:00 UT (return to pre-flare)
Figure 1. A part of RESIK catalogue page covering the times when the presented flare took place. The letters (A, B, ... , G) correspond to selected intervals for which the spectra have been time-integrated (see next Figure).
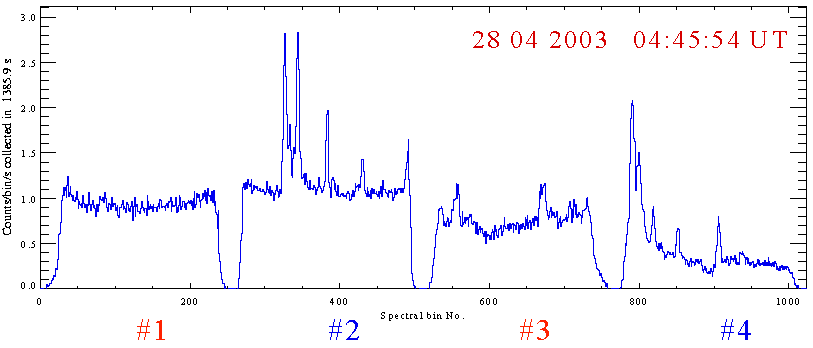
In Figure 2, we present RESIK spectra summed for selected time intervals indicated by letters A G (Figure 1).
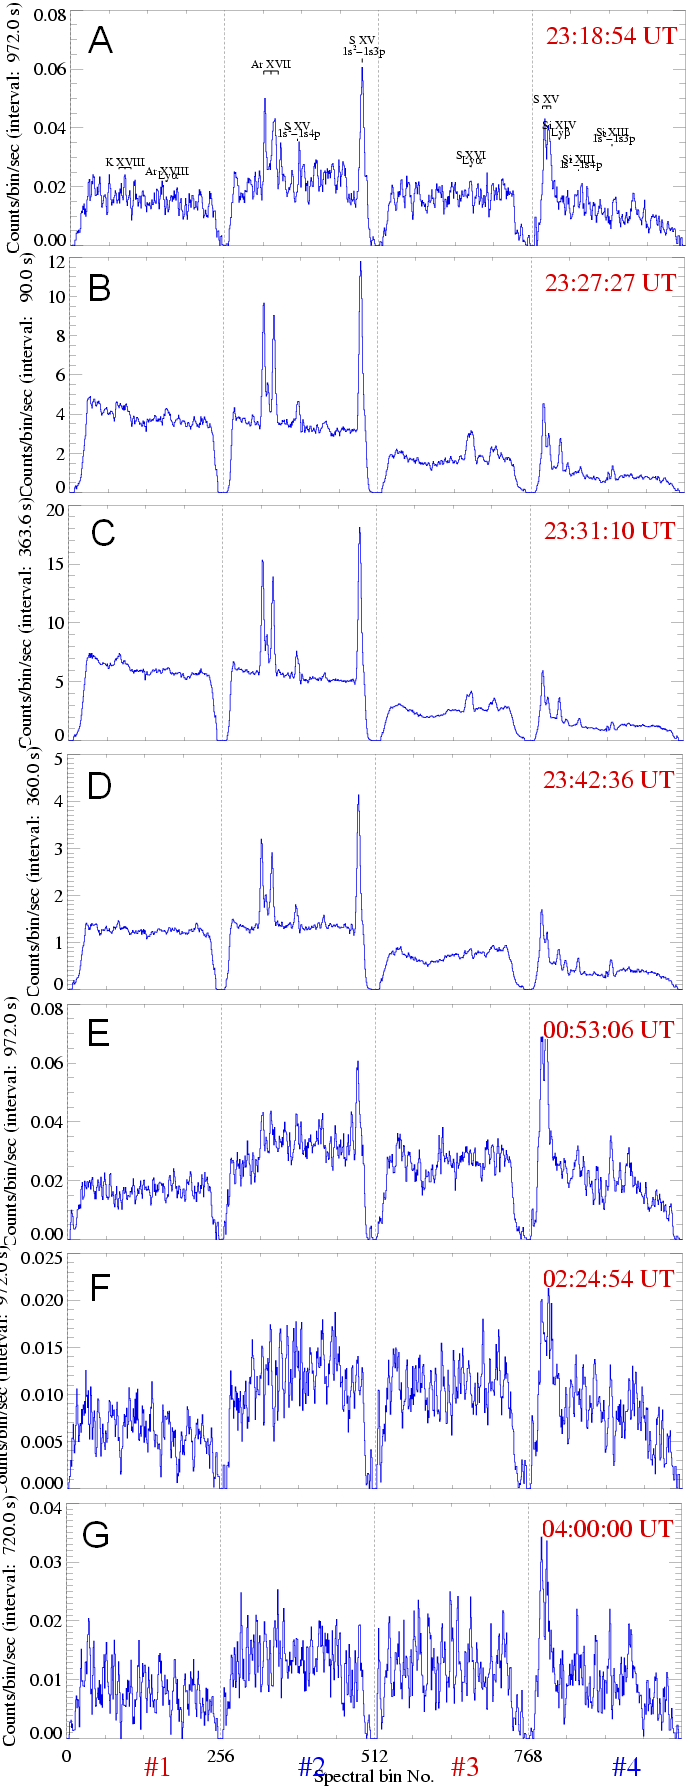
Figure 2. Averaged spectra (in cts/bin/s) measured during the consecutive intervals of 9 April 2003 event covering the pre-flare (A), steep rise (B), maximum (C), decay (D, E, F) and post-flare (G) phases. The spectra integration times are given on Y axis description. In order to remove the shot noise, the spectra have been box-car smoothed over three bins. Prompt line identification is given at the top. For the details of line identification see Weekly 40, 2002.
The inspection of spectra in individual channels for consecutive intervals indicates for the vivid changes of the flaring plasma parameters during the flare evolution. It is evident that during the rise, maximum and early decay the dominant are hot lines seen in #2 namely the triplet of Ar XVII ion and the line corresponding to the transition 1s2-1s3p in S XV ion. They are hardly seen during the pre-flare, late decay and post-flare phases when the lines of S XV, S XIV and Si XIII ions (in #4) formed in the cooler plasma dominate the spectrum.
Prepared by: Barbara Sylwester bs@cbk.pan.wroc.pl and Janusz Sylwester js@cbk.pan.wroc.pl
The report presented has been done in "real time" and so it may contain jargon, blunders, or trivialities. We do not have also an English native speaker in our Wroclaw group!
We would be happy to discuss problems mentioned above in more details if necessary.
RESIK data are in the open public domain and can be requested from: http://surfwww.mssl.ucl.ac.uk/surf/data_request.html.
Previous RESIK_weekly notes are in the archive: http://www.cbk.pan.wroc.pl/resik_archive.htm
Page made on 9 May 2003 by: Anna Kepa ak@cbk.pan.wroc.pl and Jarek Bakala jb@cbk.pan.wroc.pl