(Week 53, 2002, 30 Dec. - 05 Jan.)
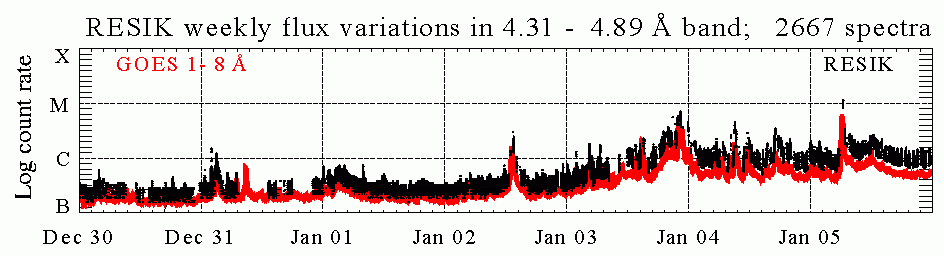
In the display above (click to enlarge), the solar X-ray fluence seen by RESIK (black points) is plotted atop GOES red line. Only periods with good spectral measurements are indicated. The total number of good spectral measurements is given in the title line.
|
Operation mode: |
'3rd order reflections'
(ORD3) is used as stand-by mode. 3rd order measurements are indicated on the main catalogue page http://www.cbk.pan.wroc.pl/2002.htm (cf. green boxes).
|
|
|
Calibrations made: |
On 31 December 2002 between 12:00:50 UT and 18:00:00 UT another Amplitude Discriminator Scan calibration has been executed with the calibration radioactive Fe55 source ON. Prompt analysis indicates no changes in detector's gain and the electronics in respect with ground calibration results. | |
|
ADS Settings: |
||
|
| ||
| (ORD1) HV: Det. A - 1450 V, Det. B - 1419 V. | (ORD3) HV: Det. A - 1389 V, Det. B - 1328 V. | ||||||
|
Channel |
l Band |
ADS |
Channel |
l Band |
ADS | ||
| #1 | #2 | 3.37 - 3.88 Å | 35 - 85 | #1 | #2 | 1.16 - 1.29 Å | 110 - 230 |
| #2 | #0 | 3.82 - 4.33 Å | 80 - 160 | #2 | #0 | 1.27 - 1.44 Å | 110 - 230 |
| #3 | #3 | 4.31 - 4.89 Å | 55 - 110 | #3 | #3 | 1.44 - 1.63 Å | 110 - 230 |
| #4 | #1 | 4.96 - 6.09 Å | 135 - 200 | #4 | #1 | 1.65 - 2.03 Å | 140 - 230 |
|
software indexes |
|
software indexes | |||||
|
spectroscopic notation (papers) |
spectroscopic notation (papers) | ||||||
Data gaps due to missing telemetry: ~ 10.5 h.
Note, that the link to the catalogue page has changed. It is now: http://www.cbk.pan.wroc.pl/resik_catalogue.htm. Starting from week 01, 2003, an improved catalogue page is used (c.f. W01, 2003) combining into one page the information previously reported in two pages. A new 2003 Catalogue Legend is in preparation.
RESIK Low Activity Spectra
It is generally known that the shape of the X-ray spectra and relative line intensities depend on the physical conditions prevailing in the coronal plasma. These conditions are determined by the solar activity level. The activity level has changed over the year 2002 quite substantially. The Sun generated several X-class flares (see yellow boxes on http://www.cbk.pan.wroc.pl/resik_catalogue.htm). Recently, the solar activity reached very low level.
In the previous Notes, we have shown RESIK spectra recorded during flares only (as the instrument has been designed to observe flares at most).
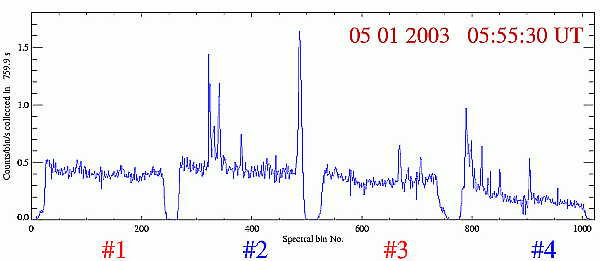
Below we present the spectra recorded by RESIK during periods of low activity. We selected for the illustration only the spectra, recorded with the ORD1 observing mode (c.f. Notes #44, W44, 2002), since with this observation mode, the influence of the fluorescent Si radiation coming from the crystals is less pronounced. This is especially important for the spectra recorded in the longer-wavelength Channels #3 and #4. For the present illustration, we selected spectra taken over the last Christmas and New Year period, when solar activity reached its lowest level during recent activity cycle and we can safely assume that the Sco X-1 moved out of RESIK field of view, i.e. direct illumination of detector windows (c.f. W51, 2002) is not important.
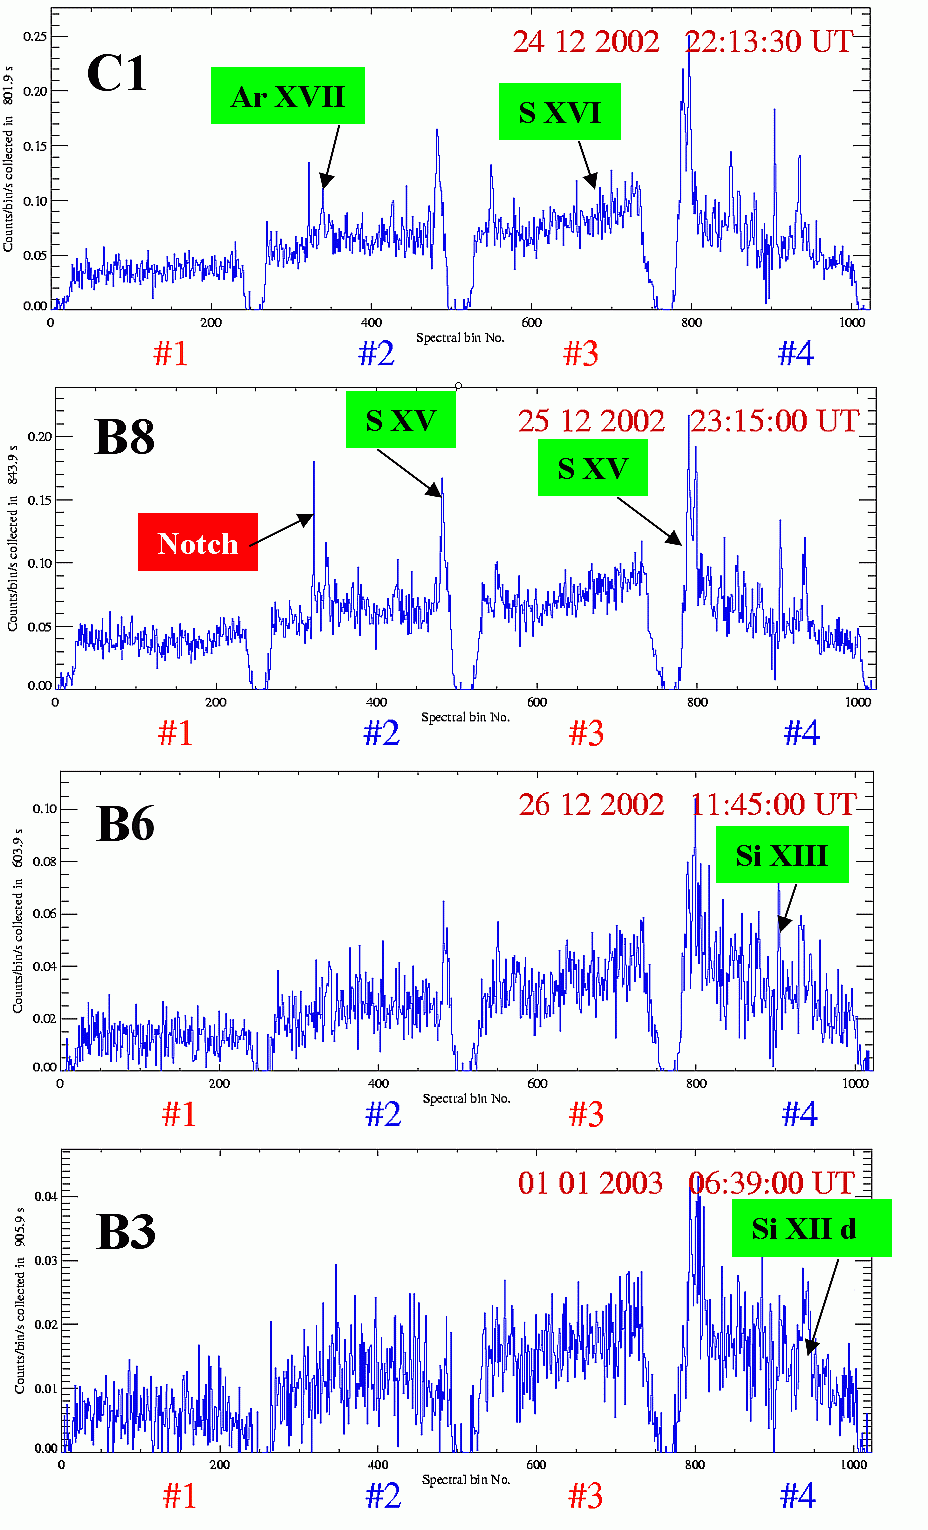
Figure 1. Examples of RESIK spectra taken for various (decreasing from top to bottom) levels of solar activity. The activity level (in GOES scale) is indicated in the upper-left corner of each panel. On some spectra, the notch effect is pronounced and should not be misinterpreted as the line emission. The identification of the important emission features is given (for details see Weekly#40, W40, 2002).
It is seen that the emission of 'hotter' (T > 7MK) Ar XVII and S XV He-like line complexes diminish successively as the activity level
decreases. At the same time, the spectral feature located at the bin position ~940 in Channel #4
is becoming more and more important.
Prompt identification of this feature is Si XII dielectronic line corresponding to the transition
1s2 2p 2P3/2 - 1s 2p (3P)3p 2D5/2.
This observation is in agreement with a general trend that the
relative satellite line intensities increase
when the plasma temperature decreases.
It was unexpected to us to observe some line emission even
during such a low solar X-ray activity as was observed over
the Christmas and New Year period.
For the solar X-ray activity behaviour look at the
weekly plots: W52,
2002 and W53, 2002.
At the moment, the activity is rising again, coming back to the level expected
for the present phase of the activity cycle For the illustration of present and
future levels of solar activity see the plot below.
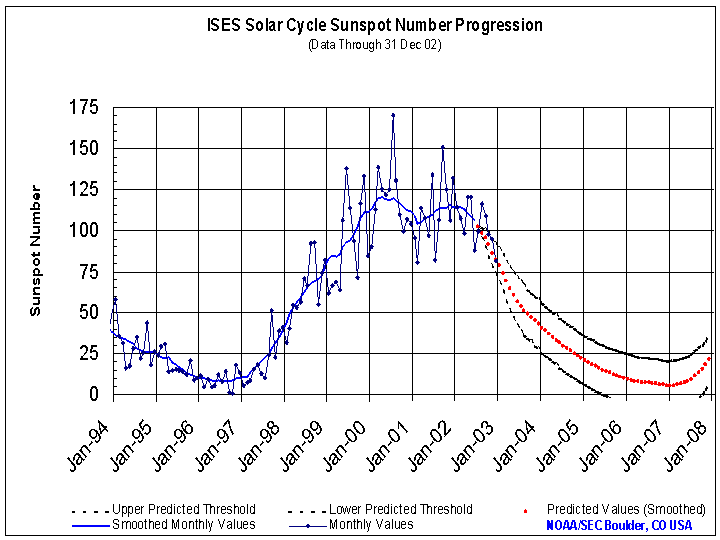
Figure 2. Observed and expected behaviour of the present 23rd activity cycle (from http://sec.noaa.gov/ftpdir/weekly/sunspot.gif).
Report prepared by: Janusz Sylwester js@cbk.pan.wroc.pl and Barbara Sylwester bs@cbk.pan.wroc.pl
The report presented has been done in "real time" and so it may contain
jargon, blunders, or trivialities. We do not have also an English native speaker
in our Wroclaw group! We would be happy to discuss problems mentioned above in
more details if necessary.
RESIK data are in the open public domain and
can be requested from: http://surfwww.mssl.ucl.ac.uk/surf/data_request.html.
Previous RESIK_weekly notes are in the archive: http://www.cbk.pan.wroc.pl/resik_archive.htm
Page made on 10 January 2003 by: Jarek Bakala jb@cbk.pan.wroc.pl and Anna Kepa ak@cbk.pan.wroc.pl