The catalog contains data from D1 SphinX detector.
| Table of contents: |
|
|
|
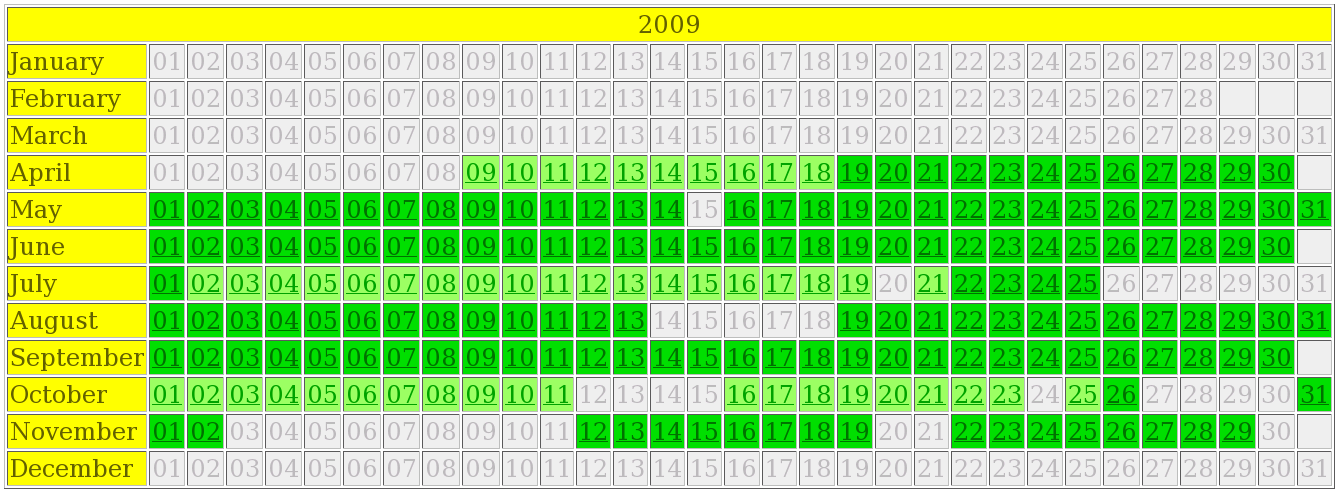
Days for which SphinX data are available are marked in green.
These day areas contain links to SphinX daily pages.
Days marked in light green refers to time periods when spacecraft did not enter optical shadow. The catalog contains data from D1 SphinX detector. |
| Back |
|
|
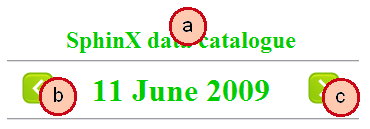
(a) - back link to main catalogue year page (b) - link to previous daily page (c) - link to next daily page |
| Back |
 |
|||||||||
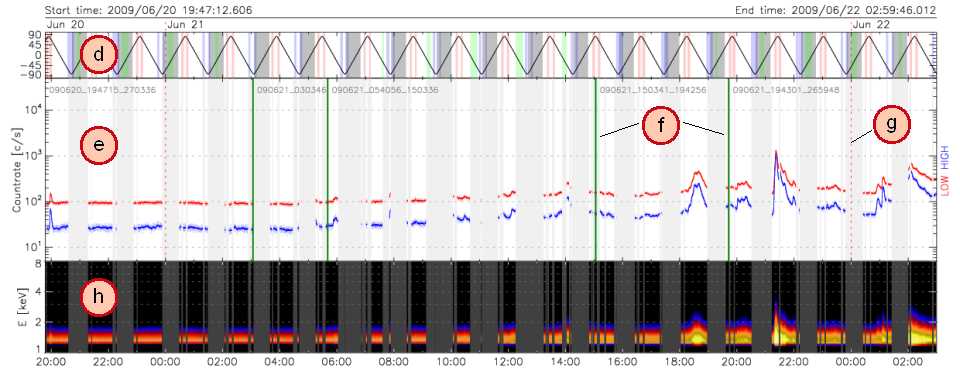
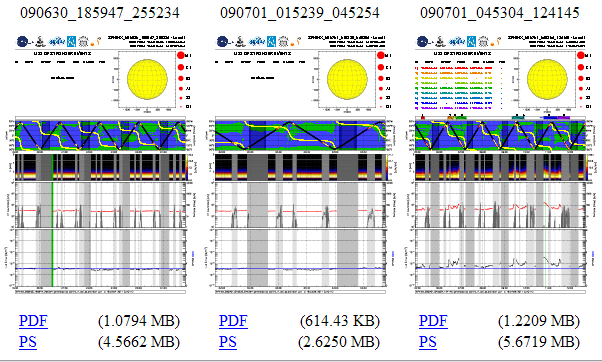
Overall daily plot contains three subplots: |
(d) CORONAS-PHOTON latitude plot with coloured areas indicating some flags. Color convention is:
|
(e) SphinX lightcurves in two channels: |
Low (red curve): countrates of photons within energy range 1.16 - 1.5 keV. High (blue curve): countrates of photons within energy range 1.5 - 15.07 keV. Vertical green lines (f) correspond to the start and end time for data in individual files. Vertical red dashed lines (g) correspond to the start and end particulars days.
(h) Solar spectra against the time. SphinX flags are shaded in gray.
|
| ||||||
| Back | |||||||||
|
|
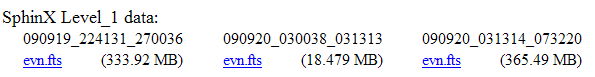
This section of daily page contains links to the SphinX data FITS files (OGIP-93/003 format). The file ID contains information about start and end time of stored data as follows: YYMMDD_HHMMSS_HHMMSS, where:
For example if the file name is SPHINX_090718_230838_260933.sav it means that stored data begins on 2009-07-18 at 23:08:38 and ends on 2009-07-19 at 02:09:33 Note that hours equal or greater than 24 (marked red in the example file name) means that stored data ends the next day. |
| Back |
|
| This section of daily page contains previews of SphinX science pages for each individual FITS file. These pages show more details which can be useful for scientific purposes. |
| Back |
|
||
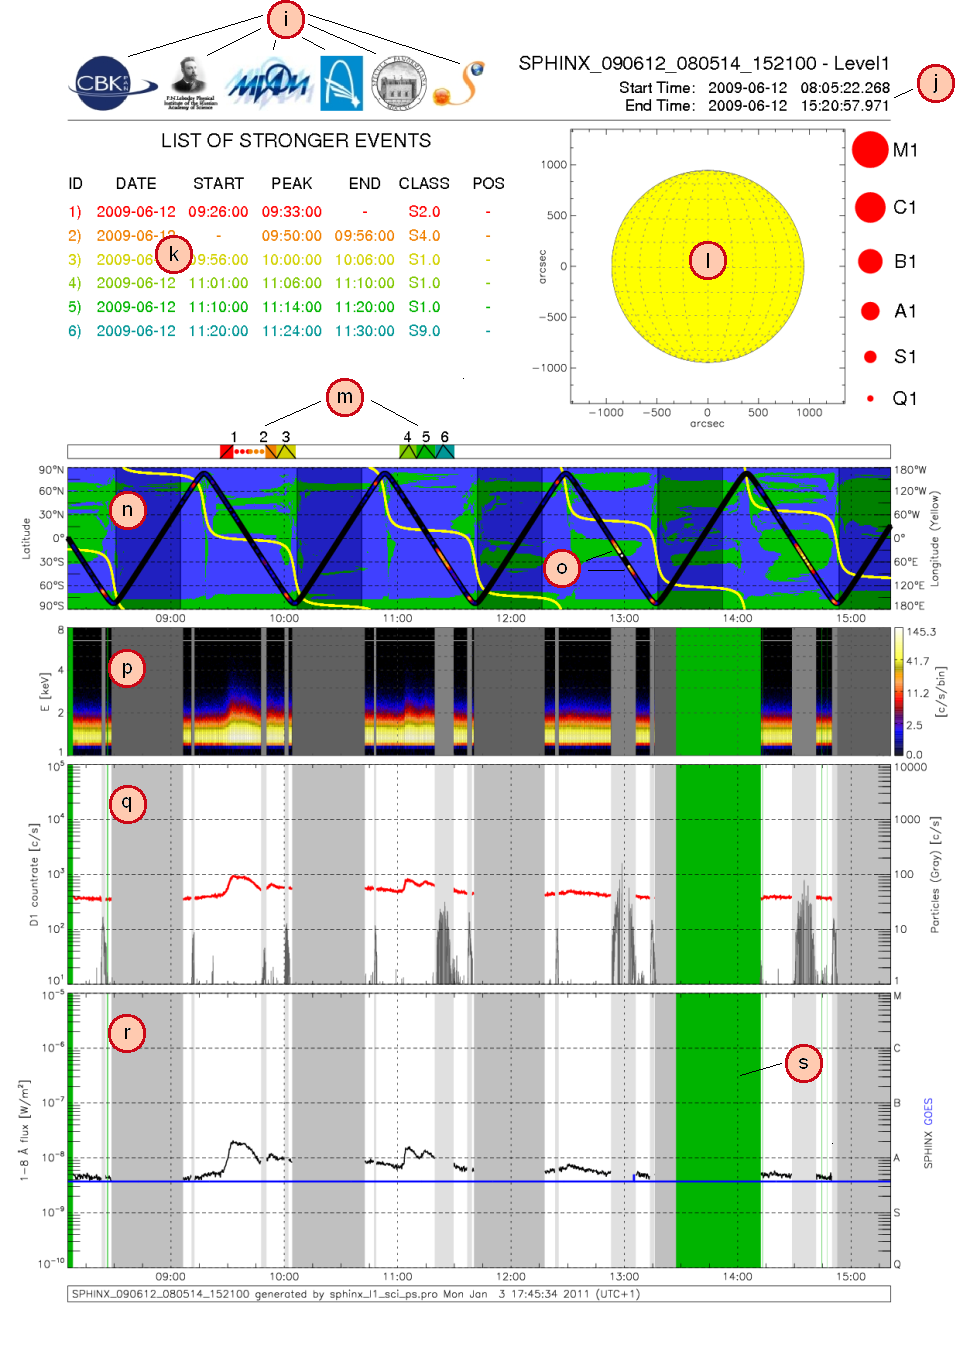
| The SphinX science page shows following details: | ||
| (i) | - Logos of institutions involved in SphinX experiment | |
| (j) | - Time coverage of data plots | |
| (k) | - List of stronger events observed by SphinX and GOES | |
| (l) | - Plot of flare position on the solar disk (plotted if available) | |
| (m) | - Stronger events timelines | |
| (n) | - CORONAS-PHOTON orbit plot. It shows the satellite position against the time and spacecraft optical/X-ray nights | |
| (o) | - Particle signal over the latitude plot provides information about spacecraft crosses through the polar ovals or SAA | |
| (p) | - Solar spectra against the time | |
| (q) | - SphinX lightcurve in counts/s (red curve) and particle countrate (gray curve) for detector D1 | |
| (r) | - Solar flux in 1-8 A energy band calculated from SphinX data ontop that observed by GOES (blue colour) | |
| (s) | - Non-solar effects flag (green area) | |
| The classification of X-ray Solar Flares (traditionally used for GOES): | |||
| X1 | - 10 -4 | [W/m2] | |
| M1 | - 10 -5 | [W/m2] | |
| C1 | - 10 -6 | [W/m2] | |
| B1 | - 10 -7 | [W/m2] | |
| A1 | - 10 -8 | [W/m2] | |
| Two new flare classes introduced by SphinX Team: | |||
| S1 | - 10 -9 | [W/m2] | |
| Q1 | - 10 -10 | [W/m2] | |
| Back | |||