| Title: | EVOLUTION OF FLARING PLASMA COMPONENTS ON DIAGNOSTIC DIAGRAMS | |
| Authors: |
J. Sylwester, B. Sylwester, K. J. H. Phillips, A. Kępa |
|
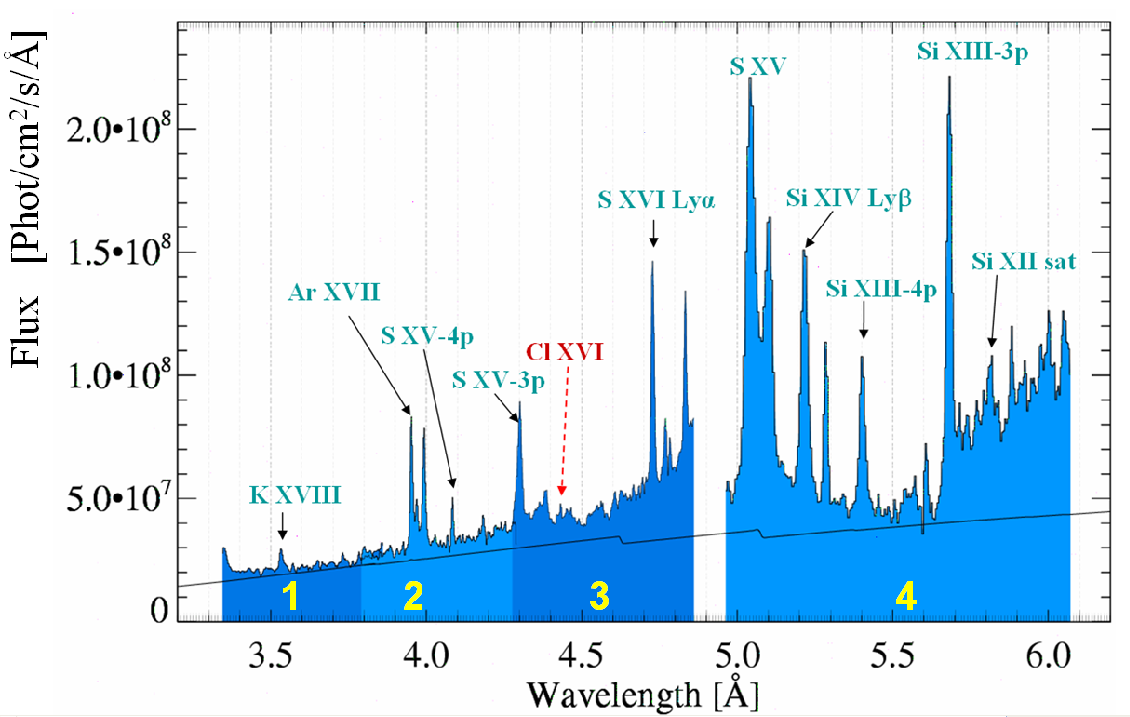
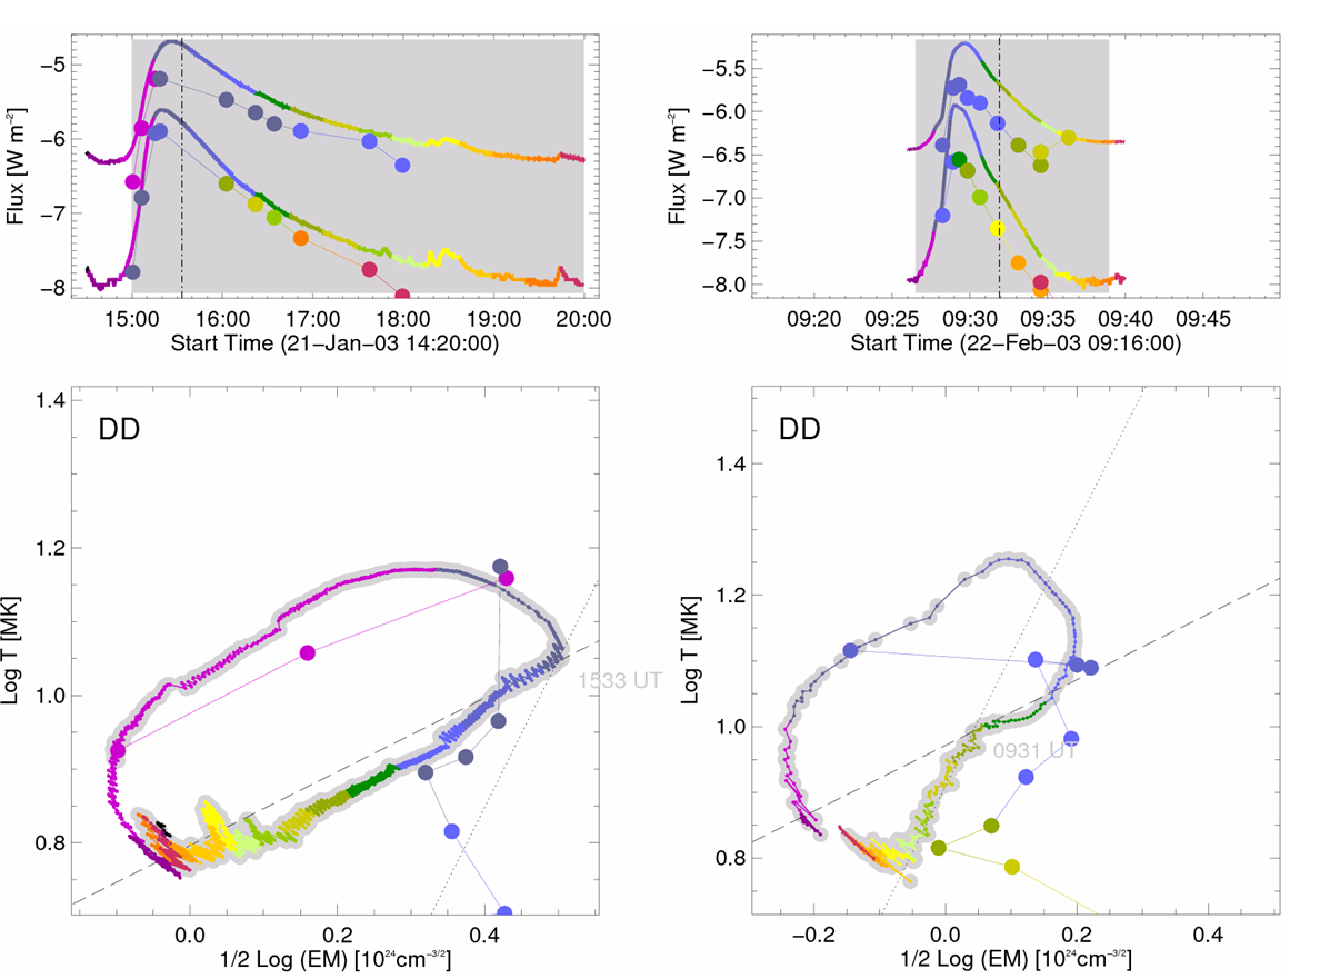
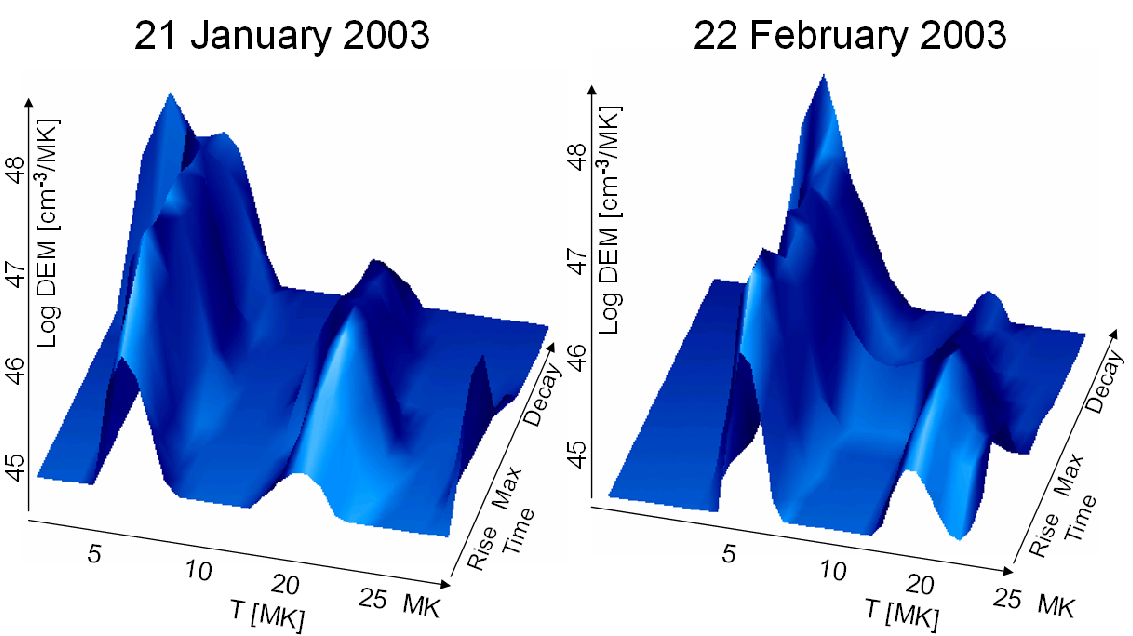
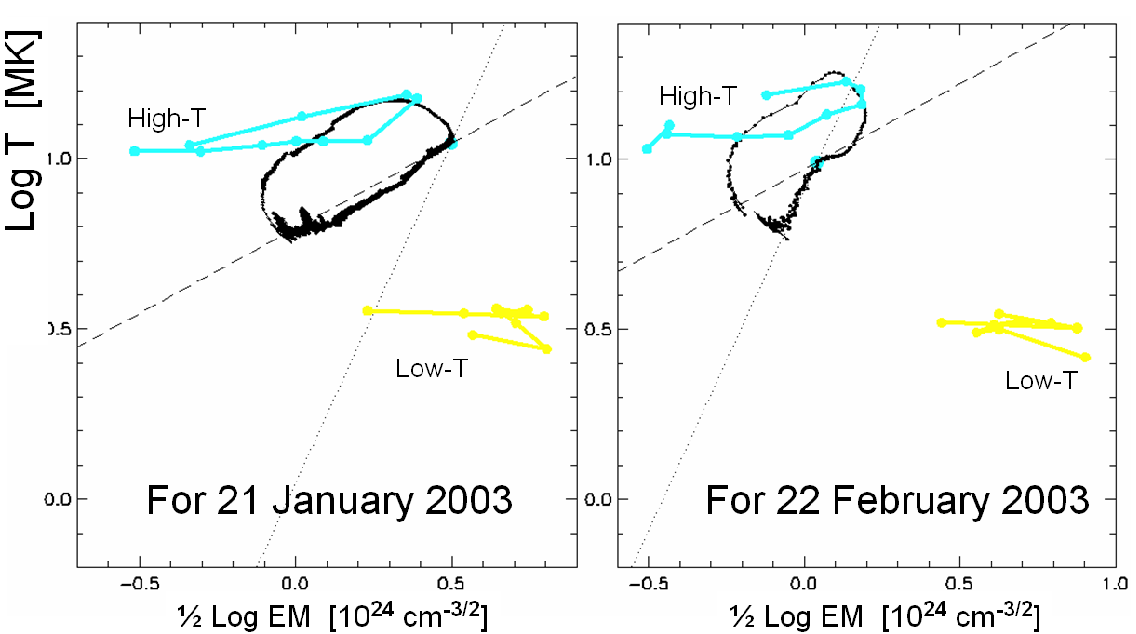
| Abstract: | Sequences of RESIK high-resolution X-ray spectra observed for selected, moderate importance flares have been used to determine time variations of absolute fluxes in a number (~ 20) of lines formed in the temperature range from 3 MK to 50 MK. Based on measured line fluxes, corresponding differential emission measure (DEM) distributions have been calculated at various times throughout the flare, showing up two distinctive plasma components with a lower (3 MK < T < 12 MK) and higher (T > 12 MK) temperatures. Images of flares obtained from SOHO-EIT and/or TRACE have been used to unveil the flare geometry. GOES soft X-ray data have been used to study overall flare energy balance. We have constructed so-called diagnostic diagrams ( Temperature-Emission Measure) from GOES data and for the comparison for each temperature component from RESIK DEM inversion. The results obtained show-up that a straightforward interpretation of evolutionary tracks obtained from GOES may not be directly possible. |
| FULL VERSION-HTML | ||||
| Get pdf (328 kb) | ||||
| Figures: |
|
|
||
| Figure3.ps.gz |
|
|
||
Page created by Jaroslaw Bakala
(
jb@cbk.pan.wroc.pl)
Web Curator: Janusz Sylwester
(
js@cbk.pan.wroc.pl)