&
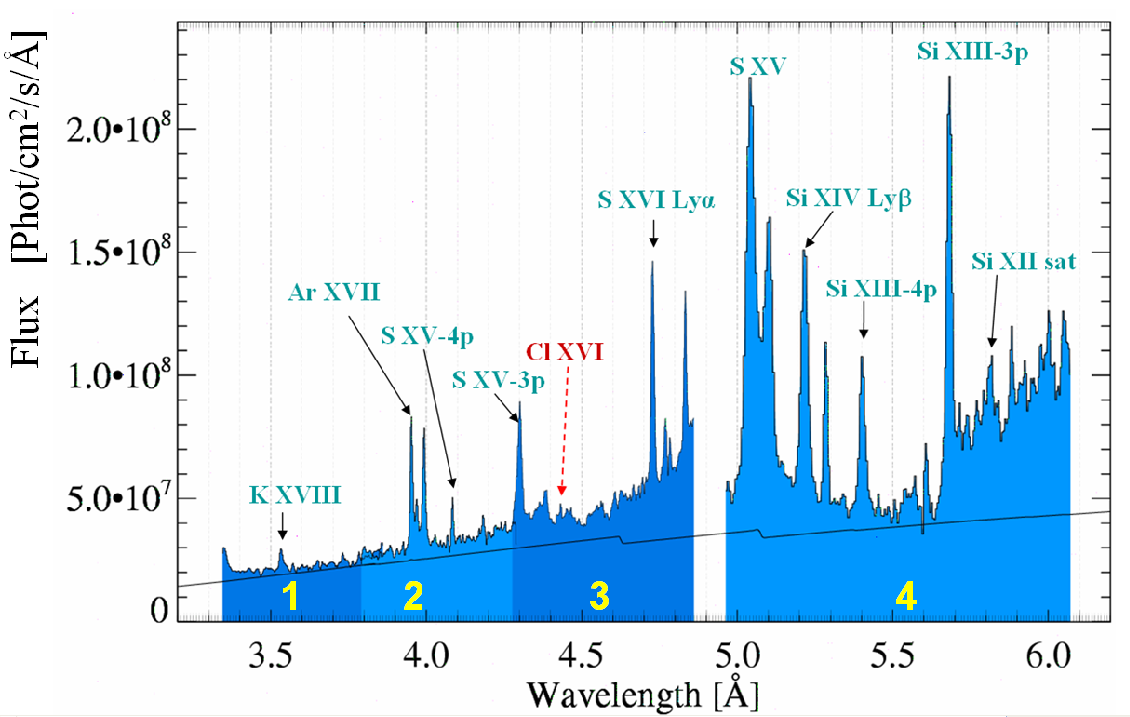
Figure 1: The reduced ESIK spectrum for flare on 22 February 2003 with the main line identifications given. The thin curve below the spectral lines represents the level of continuum as calculated based on the isothermal temperature and emission measure. The T and EM values ( 8.9 MK and 8.0 1048 cm-3 respectively) have been derived using the band-ratio technique from the fluxes observed in the first and fourth channels of RESIK. In this respect, the spectrum has been integrated over the entire flare duration (584 s). The individual RESIK wavelength ranges covered in particular spectral channels are shaded in distinct blue semitones and described in yellow.
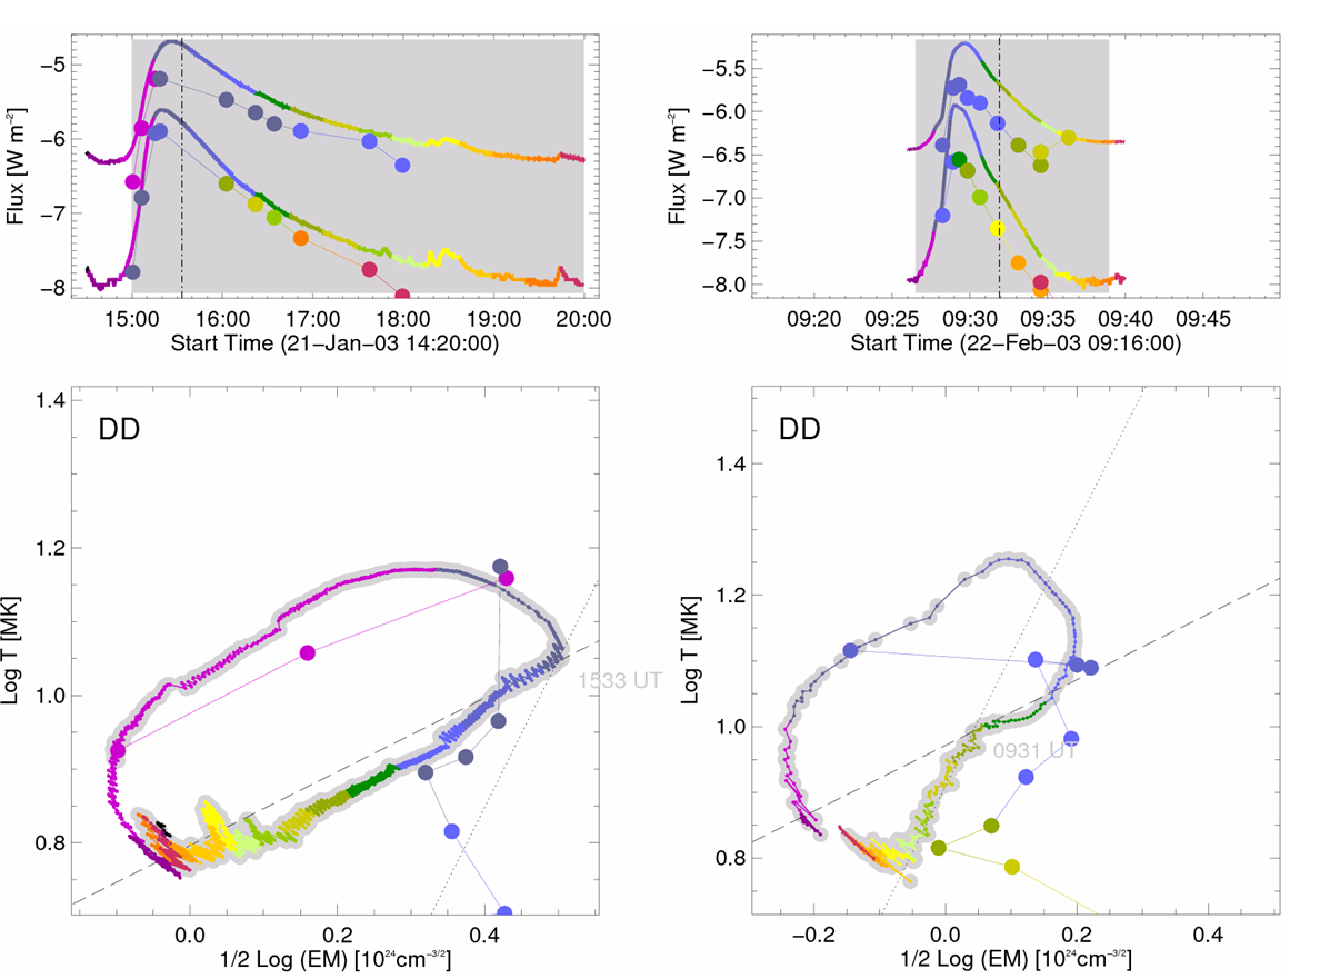
Figure 2: The results of isothermal analysis of GOES X-ray measurments in the two standard channels. At the top panel the GOES fluxes in the 0.5 - 4 Å and 1 - 8 Å bands are shown with the gray areas indicating times where the RESIK spectra are available. At the bottom, in the diadnostic diagram (DD) the evolution of T and EM is presented. The left and right panels show results obtained for the flare on 2003 January 21, and February 22 respectively. For comparison, the results of RESIK band-ratio determinations of T and EM are overplotted in the DD using the same color-scheme (large filled dots). The fluxes "predicted for GOES'' from the RESIK measurements are also indicated in the lightcurves above. The two characteristic straight lines drawn in the DD represent so-called quasi steady state (dashed) and OFF (dotted) evolutionary "limiting" slopes for the decay phase analysis (see the text for details).
In the Figure 1 we present the reduced RESIK spectrum for (the short duration) B flare. If the time-integrated fluxes seen on the spectrum are interpreted in so-called isothermal approximation using the filter-band ratio technique, the average (over time and temperature) characteristics can be derived (see the Figure caption). In this respect CHIANTI (SolarSoft) atomic and spectral package has been used. These average characteristics (temperature T and emission measure EM) are used in order to calculate the predicted continuum shape (thin black line). It is seen that the continuum reasonably well represents the observed spectral shape.
The similar, simple isothermal analysis of this (and practically all the other flares) can be made with a much higher time resolution ("3s") using standard GOES X-ray absolute flux measurements in the 0.5 - 4 Å and 1 - 8 Å bands. The results of such an analysis provide values of average temperature T and emission measure EM with the time resolution good enough to study the evolution of these parameters even during the flare rise phases. A highly informative way to display and interpret the results of such an isothermal analysis of cleaned GOES data is to plot individual flare evolutionary tracks on so called diagnostic diagrams (DD). In the DD, the flare behavior is represented (in the log-log scale) by the evolutionary track of the flare temperature vs. the square root of emission measure, as shown in Fig. 2 (lower panels). In this and the other figures, the time evolution is color-coded which allows to connect each point on the track with the respective time on the lightcurves shown above. The observed pattern of the evolution in the DD is usually being interpreted based on the results of the hydrodynamic modeling (HD), especially as concerns the character and duration of flare heating. This type of analysis has been proposed by Jakimiec et al., (1992).
In order to cross-compare the results of isothermal analysis of GOES and RESIK data interpretations, we put the RESIK results (large dots) atop the GOES track in the DD. The relative positions agree well, also as concerns the range of temperature variability, indicating the overall agreement between the results of the same type, isothermal analysis. In order to push the comparison even further, we estimated the absolute GOES fluxes - as predicted from the results of RESIK isothermal interpretation. Those values are given as large dots in the upper panels of Fig. 2. It is seen that the observed GOES fluxes are factor of ~ 2 greater than the predicted. This difference may be partly accounted for as a consequence of slightly different emission functions for GOES and RESIK (channels 1 & 4) and presence of "radiometric calibration'' factor (of the order of two) between the instruments.
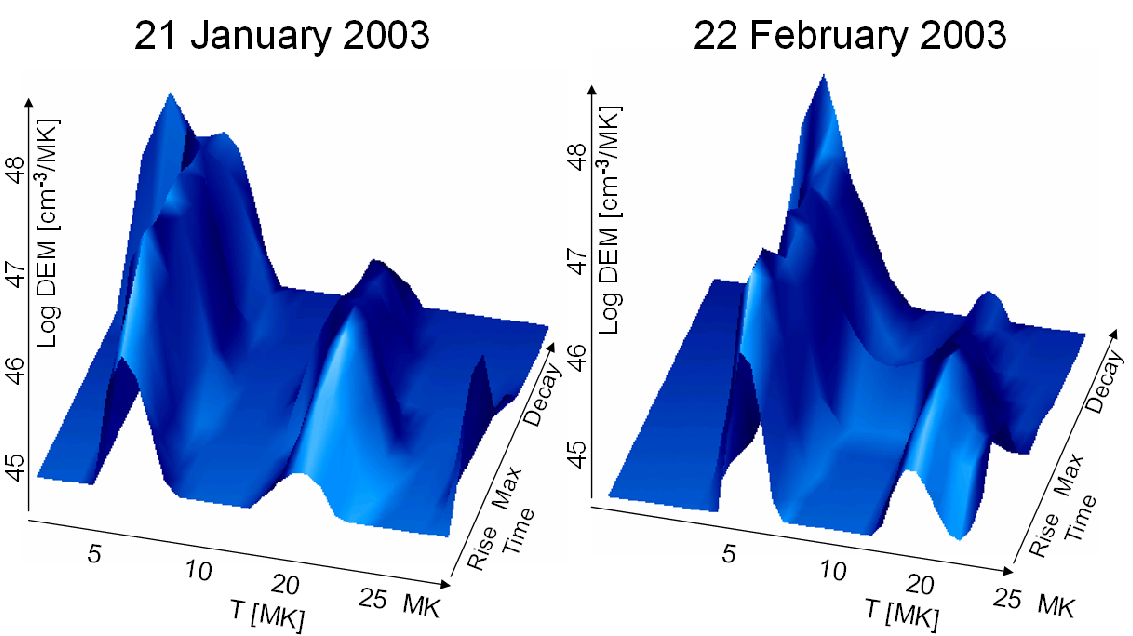
Figure 3: Evolution of DEM distributions for the two analyzed flares.
The shapes of flare evolutionary tracks, if interpreted according to the standard outline given in the Jakimiec et al., (1992), indicate for intense initial heating present in both flares (fast rise of T with a slow change in the emission measure), followed by a possible intense evaporation phase (much slower rise of T, faster rise of EM). After flare maxima, the temperature begins to fall, with EM still rising. During the decay phase, both T and EM are decreasing. The observed slope during the decay phase would indicate for initially quasi-steady-state (QSS) decrease of the heating, (inclination = 1/2) with a subsequent faster decay of the heating (growing inclination). In case of flare B, the inclination becomes ~ 2 which is characteristic for the heating being switch-OFF abruptly (Sylwester, 1996). These presented results might look quite encouraging, as they can be nicely interpreted within the framework of existing HD modeling results.
However, it is well known that the isothermal approximation provide values of T and EM, which are complicated weighted average characteristics of the source thermal plasma structure. In order to better characterize the distribution of the plasma with the temperature, so called differential emission measure distributions (DEM) are generally used. The shape of DEM distribution may be calculated from the various lines observed by RESIK and indicated in Fig. 1. RESIK spectra are the most suited in respect of DEM calculations (for flares) as RESIK provides well-calibrated fluxes measured in the same instant in a set of lines being formed over a broad temperature range (from 3 MK to ~ 50 MK). Available RESIK line flux measurements have been therefore used in order to determine the time variability of DEM shapes for a number of flares. For details of DEM calculations including the two events of interest see Kepa et al, (2005, this Proceedings).
Here, in Fig. 3, we present quantitatively the development of the DEM over time for the two selected events. It is seen that for both flares, the flaring plasma appears to have two distinct temperature components through the events, with the temperatures around T ~ 3-4 MK and ~ 15 MK. The average temperatures, characteristic for both components do not vary substantially with time, but their total emission measures do. In order to illustrate this statement in a more quantitative way, we plotted the behavior of these two individual components atop the DD, as derived (and discussed earlier-on) from the interpretation of GOES data. The results are shown in Fig. 4.
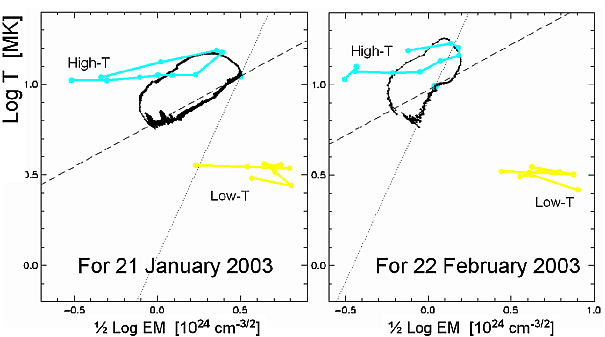
Figure 4: The comparison of evolutionary tracks as obtained from GOES data interpretation (in black) on the diagnostic diagrams with that obtained from DEM analysis of RESIK data for the hot (turquoise) and cold (yellow) components. See the text for details.
It is indeed seen that yellow and turquoise (for cold and hot components respectively) evolutionary tracks are nearly horizontal, i.e. their respective average temperatures do not vary substantially as the flare evolves. Hovever, the relative emission measures in the hot and cold components are changing. This is the relative emission measure variations which causes the looping (hysteresis) of the average GOES evolutionary track in the DD!
In conclusion, the prompt results presented should constitute a strong warning as concerns:
This research is signalling the problem, and will be followed by an exhaustive study based on analysis of tens of flares, for which determinations of DEM are possible from the RESIK data.