Keywords: Chromosphere; Corona; Flares; Magnetic fields; Hard X-rays
Solar flares with intense soft X-ray (SXR) emission (i.e. high GOES class) generally also show an intense hard X-ray emission. This is a manifestation of so-called 'Big Flare Syndrome', which states that statistically all energetic flare phenomena are more intense in larger flares, regardless of the detailed physics (Kahler 1982). The relation between hard and soft X-ray emission can be simply explained by non-thermal electrons. Electrons accelerated in the reconnection site in the corona, deposit their energy in the chromosphere via bremsstrahlung process and the hard X-ray emission is observed in the footpoints. These electrons also heat the chromosphere which evaporates, filling the magnetic loops and producing soft X-ray emission. Neupert (1968) found that the time derivative of the soft X-ray flux curve approximately matches the microwave flux of a flare impulsive burst. Similar effect was observed for hard X-ray emission (Dennis & Zarro 1993). Since hard X-rays and microwave emission are produced by non-thermal electrons, and the soft X-ray is the thermal emission of the hot plasma, the Neupert effect suggests that the non-thermal electrons are the direct source of plasma heating.
Lin et al. (1984) were the first who observed hard X-ray emission above 25 keV from microflares using balloon-borne observations. Later studies using RHESSI observations (Qiu et al., 2004) show that temporal, spatial and spectral characteristics of microflares are similar to those of large flares.
However, there are examples of flares with low SXR intensity (low GOES class events), but with an unusually strong hard X-ray emission (McDonald et al. 1997; McDonald et al. 1999; Siarkowski et al. 1999; Gburek & Siarkowski 2002). There are numerous examples showing that the hard X-ray spectra of GOES B class flares are harder than C or even M class flare spectra. This effect is especially visible in RF15-I X-ray photometer observations made by the INTERBALL-TAIL satellite. In this paper we analyse morphology and physical parameters of these small flares with intense hard X-ray, using the Yohkoh SXT images. Many of these flares may be interpreted as resulting from the interaction of magnetic loops. The interaction of magnetic structures and conversion of magnetic free energy into plasma heating and particles acceleration are commonly regarded as the origin of solar flares. The configurations of the interacting loops observed on the Sun may be described using three main models only: the I-type coalescence (interaction of two nearly parallel loops), the Y-type coalescence (interacting loops are in contact only along a part of their lengths) and the X-type coalescence, when some parts of two loops crossed approximately perpendicularly (Sakai & de Jager, 1996). Most analyses of the observational data concerning the coalescence of loops describe the I-type interactions (e.g. Takahashi et al., 1996, Inda-Koide et al., 1995), some are related to the Y-type (e.g. Hanaoka, 1994, Farnik et al., 1996) and only a few describe X-type (e.g. de Jager et al., 1995, Rudawy et al., 2001).
The RF15-I Soft and Hard X-ray Photometer (Sylwester et al. 2000) was developed jointly by the Astronomical Institute of the Czech Academy of Sciences and the Space Research Centre of Polish Academy of Sciences. It was placed aboard the INTERBALL-TAIL spacecraft launched on August 3, 1995 and operated up to October 15, 2000. The photometer performed observations of the whole solar disk X-ray flux in the energy range 2 - 240 keV. It had two detector systems: a proportional argon gas-filled counter and the NaI(Tl) crystal scintillation detector. The proportional counter detected the soft X-ray solar flux in the three energy channels 2-3, 3-5, 5-8 keV (nominal bands) every 2 seconds. By the end of 1997, these energies decreasd owing to a decrease in the strength of the Fe55 radioactive calibration source. No such effect was observed for the scintillation detector (see Sylwester et al. 2000 for details). Instead, the scintillation detector operated perfectly up to the end of the mission and measured the hard X-ray fluxes in five bands 10-15, 15-30, 30-60, 60-120, 120-240 keV (denoted as h1,h2,...h5). In the lowest hard X-ray energy range (channel h1: 10-15 keV) the data were collected synchronously with the soft proportional detector channels every 2 s.
In the remaining hard X-ray energy channels (h2 to h5, i.e. 15-240
keV) X-rays were detected every 0.125 s as long as the rate threshold (40 c/s
for all channels) was exceeded. During the first three years of observations,
RF15-I detected about 1800 significant flares (Siarkowski et al. 1999). "Significant"
means that the entire flare time profile was observed without interruption by
magnetospheric particle contamination. All the photometer data from August 1995
to the end of 1999 are available online at www site:
http://www.cbk.pan.wroc.pl/RF15-I_www/default.htm.
The
database forms a valuable source for analysis of X-ray solar events that
appeared during the rise phase of the 23rd cycle of solar activity. Among the
observed flares, 6 were of X, 48 of M, and 576 of C GOES class. All flares with
GOES class above C3 (256) have a clear emission component seen in the h2 channel
and all flares above M3 class (20) have a noticeable emission in the h3 channel.
The spatial structure of the flares analysed was examined (when possible) using Yohkoh Soft (SXT) and Hard (HXT) X-ray Telescope data. The "full resolution" SXT partial frame images, i.e. with spatial resolution 2.46" or 1800 km (Tsuneta et al. 1991) were used. Unfortunately, as the soft X-ray emission is often low for these events, images were co-added, so producing a low time resolution. For several flares, Yohkoh observations were unavailable (the SXT was viewing an other active region on the Sun). Nonetheless, using the available flare images we found that there was a great variety in possible loop configurations. For most flares studied, the HXT count rates are small (a few counts/s/subcollimator in the M2 channel), preventing image reconstruction.
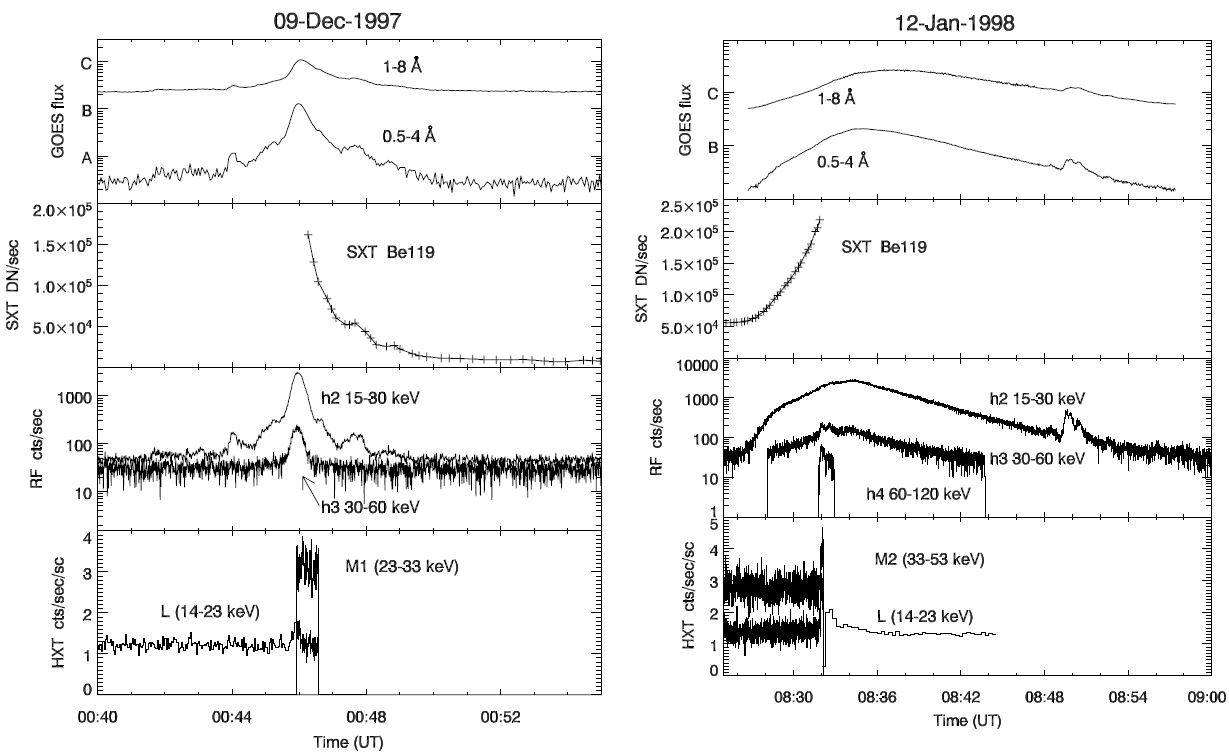
Figure 1: X-ray light curves for two analysed flares. From top to bottom the flux variation as measured by GOES, SXT, RF15-I and HXT for 9 December 1997 (left) and 12 January 1998 (right).
In Figure 1 we present a comparison of X-ray light curves as measured by GOES, SXT, RF15-I and HXT for two of analysed flares. One can notice the higher RF15-I sensitivity in comparison with Yohkoh HXT. GOES and SXT light curves in this figure indicate that SXT observed the proper flaring active region.
There are many flares for which the GOES class does not necessarily represent a measure of the slope for the corresponding X-ray spectra. This effect is especially visible in RF15-I measurements. This photometer detected many C class flares without significant emission above 15 keV and several M class flares without significant emission above 30 keV. By contrast, we observed numerous flares of class B with significant emission above 30 keV. An example is presented in Figure 2 (Siarkowski et al. 1999) where the M1.0 flare has no significant emission above 30 keV. This event is compared with a very weak B8.8 flare having a significant emission above 60 keV.
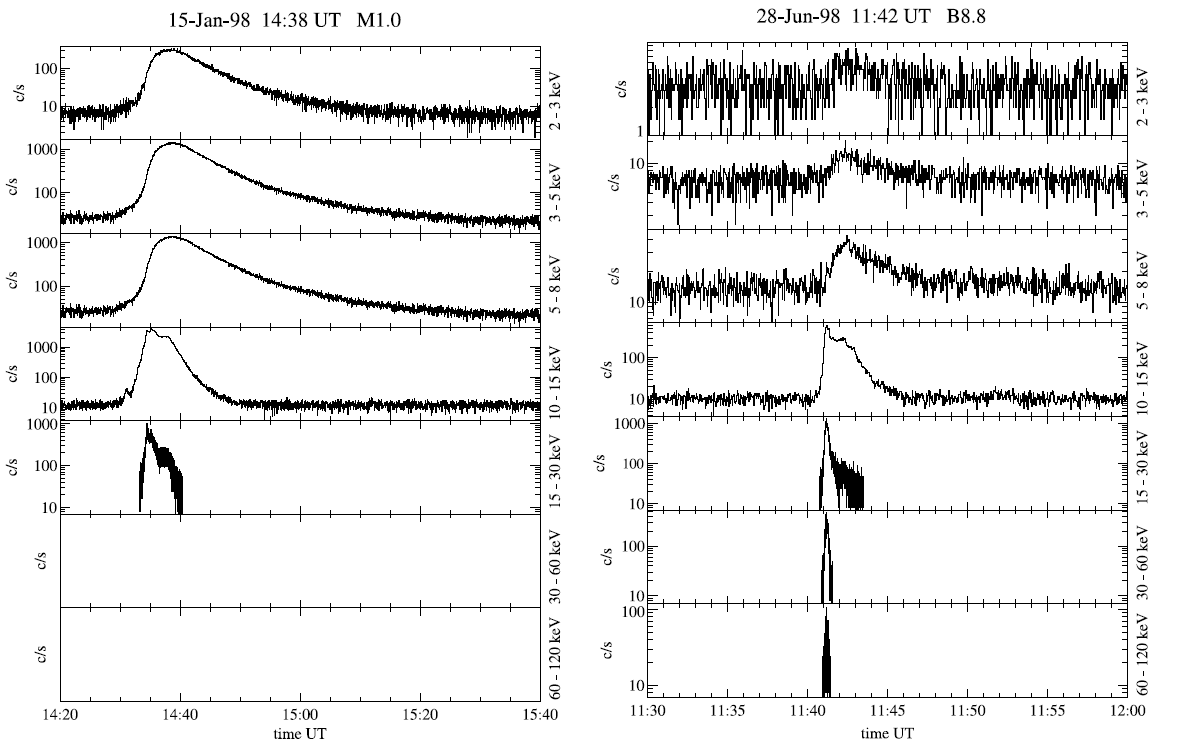
Figure 2: Comparison of the X-ray fluxes observed by the RF15-I photometer onboard INTERBALL spacecraft, plotted for M1.0 (left) and B8.8 (right) flares. The unusual hard X-ray emission was observed for the B8.8 flare.
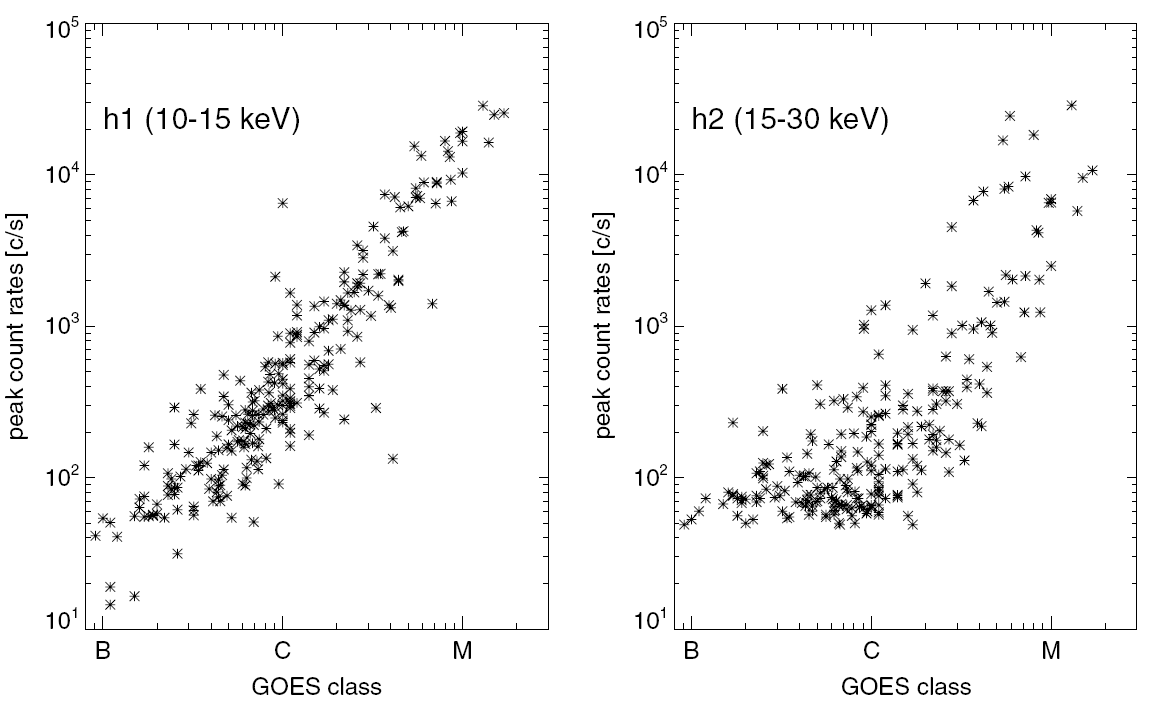
Figure 3: Peak count rates in channel h1 (left) and channel h2 (right) as a function of GOES class.
Using the X-ray data from the INTERBALL photometer we found 151
events with significant hard X-ray emission above 30 keV and a relatively low
emission in soft X-rays (GOES class C5.0 or lower) (Gburek & Siarkowski 2002). A
list of these events with their light curves recorded by RF15-I photometer can
be found at:
http://www.cbk.pan.wroc.pl/RF15-I_www/super_hard_RF_events/smallsuperhard.htm.
Figure 3 shows the distribution of the peak count rates measured in channels h1 and h2 as a function of GOES class for these events. There is a clear correlation between the GOES class and the peak count rate in h1 channel. This is simply a manifestation of 'BFS', i.e. the hard X-ray peak count rate increases with the GOES class of the flare. For higher energies (right panel in Figure 3) there is still a correlation, but the dispersion increases, particularly for channels h3 and higher.
Below we present some examples of SXT images we have found up to now.
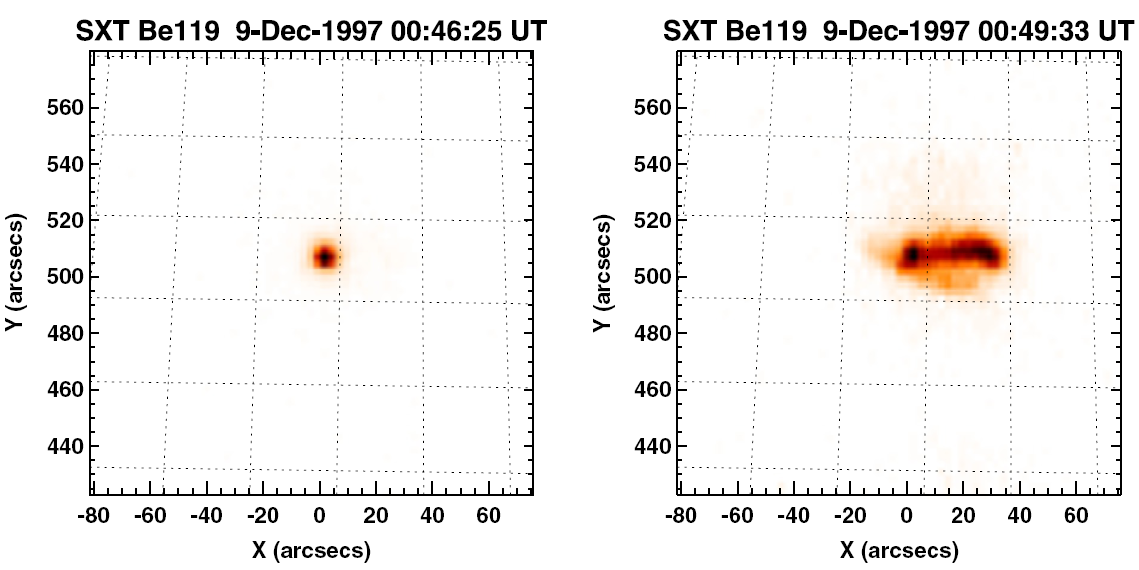
Figure 4: SXT/Be119 filter image of the December 9, 1997 flare close to the time of flux maximum (left) and near the end of the flare (right). The dotted lines represent a heliographic grid with spacing of 2 degrees.
In Figure 4 (left panel) we present an image of the flare on December 9, 1997 at 00:46 UT (time of maximum emission). This B7.9 flare has a total duration of 6 minutes. It is one of a few examples of very compact events with real sizes probably well below the SXT resolution limit. Only up to four SXT pixels (one pixel = 2.46") are located within the 50 % contour level of the peaks of the individual images. As the flare emission decays, a small loop appears to develop (Fig. 4 - right panel) which is too faint to notice at flare maximum. The comparison of both images suggests that at the maximum of the flare, the soft X-ray emission occurred predominantly in the vicinity of one of the footpoints of this loop. Assuming a semi-circular loop model we estimated the half length of this loop (L0) to be less or equal to 15 000 km and height h Ł 10 000 km.
It is interesting to note that the temperature obtained from the SXT Al11/Be119 filters ratio (Te=8.8 MK) is much lower than the temperature from the ratio of the two GOES channels (Te=11.9 MK). For this event, we estimate that the total volume V and emission measure EM of the soft X-ray source are respectively V=4.5 ×1025 cm3 and emission measure EM=5.8 ×1047 cm-3. This lead to a mean density of 5.7 ×1010 cm- 3.
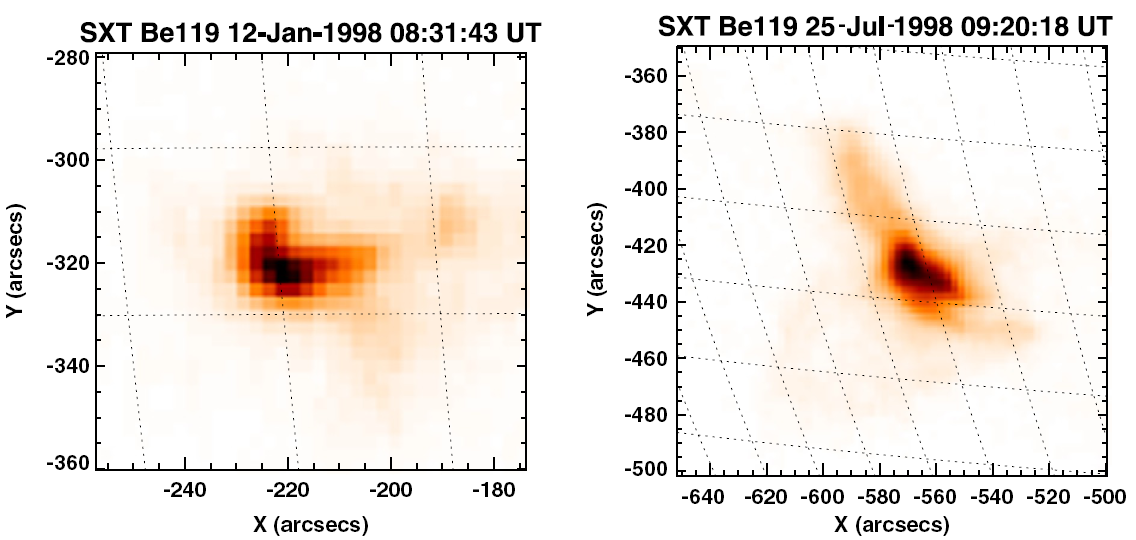
Figure 5: Example of single loop flare as seen with SXT/Be119 filter on January 12, 1998 (left). On the right a SXT/Be119 filter image for class C1.4 flare on July 25, 1998 is shown. The dotted lines represent a heliographic grid with spacing of 2 degrees.
In Figure 5 two next examples are presented. The left panel shows the C2.5 flare on January 12, 1998 with maximum emission at 08:37 UT. In the SXT/Be119 filter image taken at 08:31 UT (during the impulsive phase), we can see a typical example of the single loop flare, where loop top kernel dominates the SXT emission. In the right panel of Figure 5 the C1.4 flare of July 25, 1998 with a more complicated loop geometry is presented. In this case we estimate that L0 Ł 20 000 km and h Ł 12 500 km.
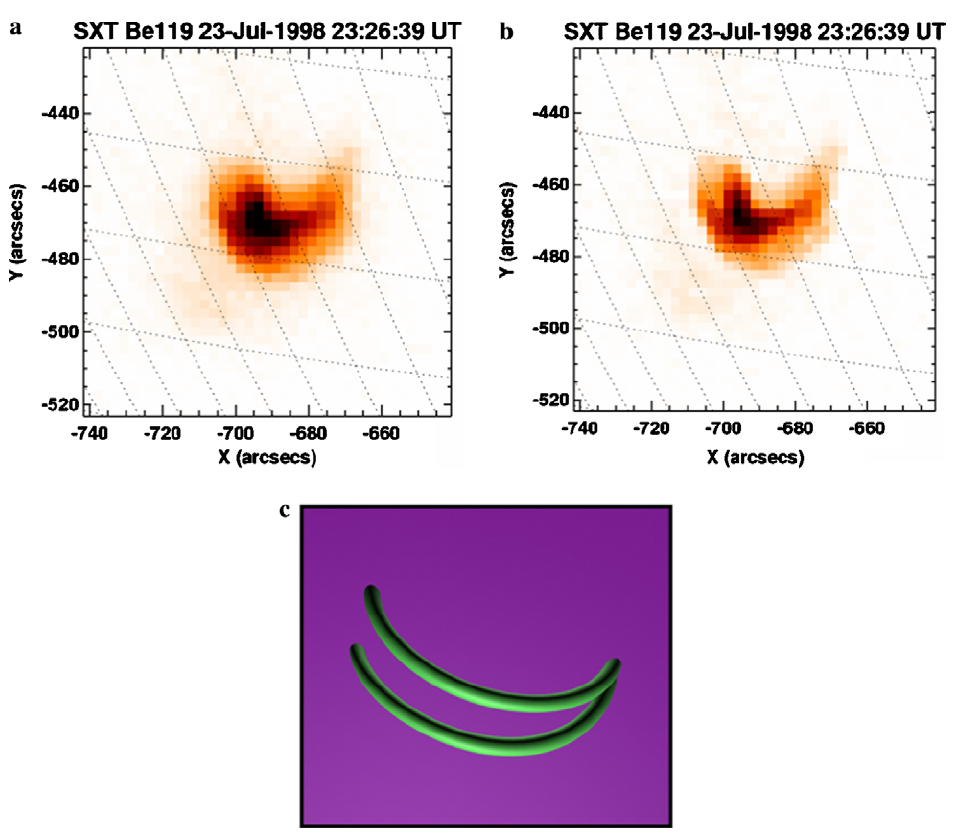
Figure 6: a) Full resolution SXT/Be119 filter image for July 23, 1998 event. b) The same image after deconvolution. c) Proposed scheme of loops seen during this flare. The dotted lines represent a heliographic grid with spacing of 2 degrees.
Figure 6a shows an SXT/Be119 image for the B6.9 flare on July 23, 1998 which peaked at 23:24 UT. Two nearly parallel loops are seen, with footpoints close together. To show the reality of these two loops we deconvolved this image by removing the instrumental profiles with standard Solar Soft software: see Figure 6b. Figure 6c shows a possible schematic loop configuration. Again we obtain L0 Ł 15 000 km and h Ł 10 000 km for these loops. We interpret this event as a good example of the simple Y-type interaction of two loops with contact regions situated in the vicinity of their footpoints. Impulsive hard X-ray emission in such a scenario occurs simultaneously with a Y-type reconnection between the two loops.
An Y-type interaction occurs when the reconnection area between the two loops is small when compared with their lengths. Two other types of loop interactions are possible (Sakai & de Jager 1996): I-type (interactions between two parallel loops) and X-type (one loop intersecting a second nearly perpendicularly). An example of an X-type configuration can be seen in Figure 7, showing an SXT/Al12 filter image for the August 2, 1999 flare. This flare was of GOES C3.0 class and had significant emission in INTERBALL channel h4, i.e. above 60 keV. The duration of the event observed in soft X-rays was about 4 min; the peak of the impulsive, hard X-ray burst was at 09:16 UT. A possible schematic loop configuration for this event is shown in the right panel of Figure 7. In this case the loops are larger. The determined length of the the flaring loop is L0 ~ 36 000 km and h Ł 23 000 km.
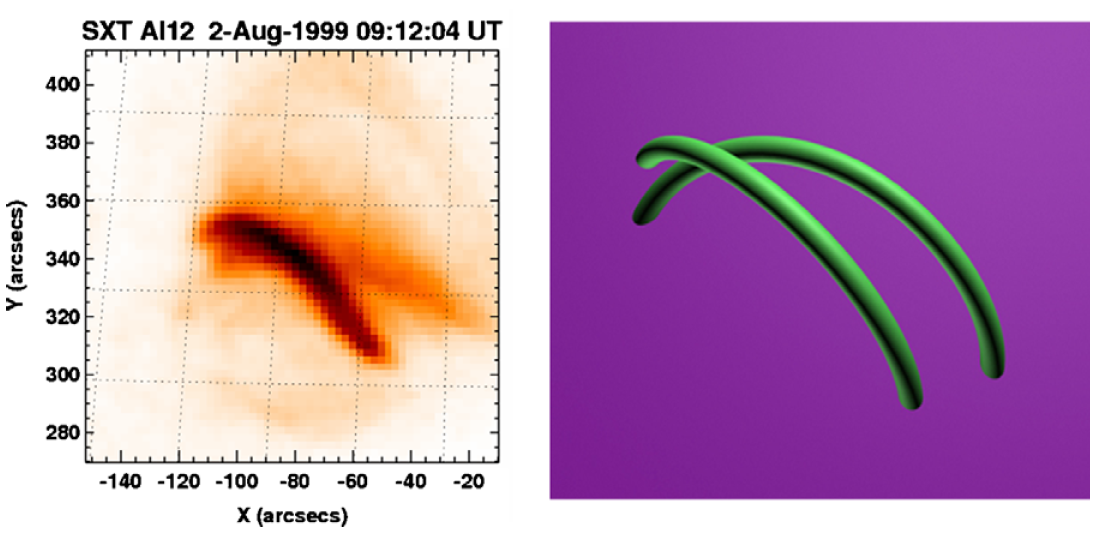
Figure 7: (Left:) SXT/Al12 filter image taken on August 2, 1999 at 09:16 UT. (Right:) Possible schematic loop configuration for this event. The dotted lines represent a heliographic grid with 2 degree spacing.
Using SXT images we have shown that the morphology of the soft X-ray emitting region highly varies from flare to flare showing nearly all-possible loop configurations:
These flares do not differ significantly in their morphology from large intense flares for which the strong soft and hard X-ray emission is observed. However, all the structures presented are generally compact. All presented flares also have significant emission at least in INTERBALL channel h3 (30-60 keV). The Y-type loops' interaction occurs low, near the loops footpoints, where the plasma is denser; this provides a possible explanation for the unexpectedly strong hard X-ray emission observed in these events. Only in the case of X-type interaction the loops are larger. As pointed out by Sakai & de Jager (1996) strong hard X-rays can be produced by the process of an X-type interaction.
The fact that the high-energy X-ray spectra of the analysed flares are harder than usual, can explain their lack of the intense soft X-ray emission. Intensity of the soft X-ray emission corresponds directly to the process of chromospheric evaporation, and the efficiency of this evaporation is strongly affected by the energy spectrum of the incident electron beam. It was shown (Mariska et al. 1989; Antonucci et al. 1993; Ranns et al. 2000) that for steeper spectra more of the input electron energy would be converted into chromospheric evaporation than can be radiated or conducted away from the energy deposition site.
Moreover, McDonald et al. (1999) present an example of four small flares with intense hard X-ray emission for which only a small percentage of the non-thermal electron beam energy was deposited above the flare transition region (i.e at locations where the heating rate of the electron beam exceeds the radiative cooling rate of the ambient plasma). It seems that in the case of flares analysed by McDonald et al. the electron beam penetrates very deep into the dense chromosphere where its energy is so effectively radiated away that it cannot power the chromospheric evaporation, thus reducing the soft X-ray emission.
Acknowledgements
We are grateful to unknown referees for their useful comments and suggestions. We also thank to K.J.H. Phillips and B. Sylwester for reading the manuscript and their useful comments. MS was supported by the Polish Committee of Scientific Research, grant number PBZ KBN 054/P03/2001. RF was supported by the grant No. 2 PO3D 001 23 of the Polish Committee of Scientific Research. AB was partially supported by the European Commission through the RTN programme (European Solar Magnetism Network, contract HPRN-CT-2002-00313).