Cent. Eur. Astrophys. Bull. (2007) in press
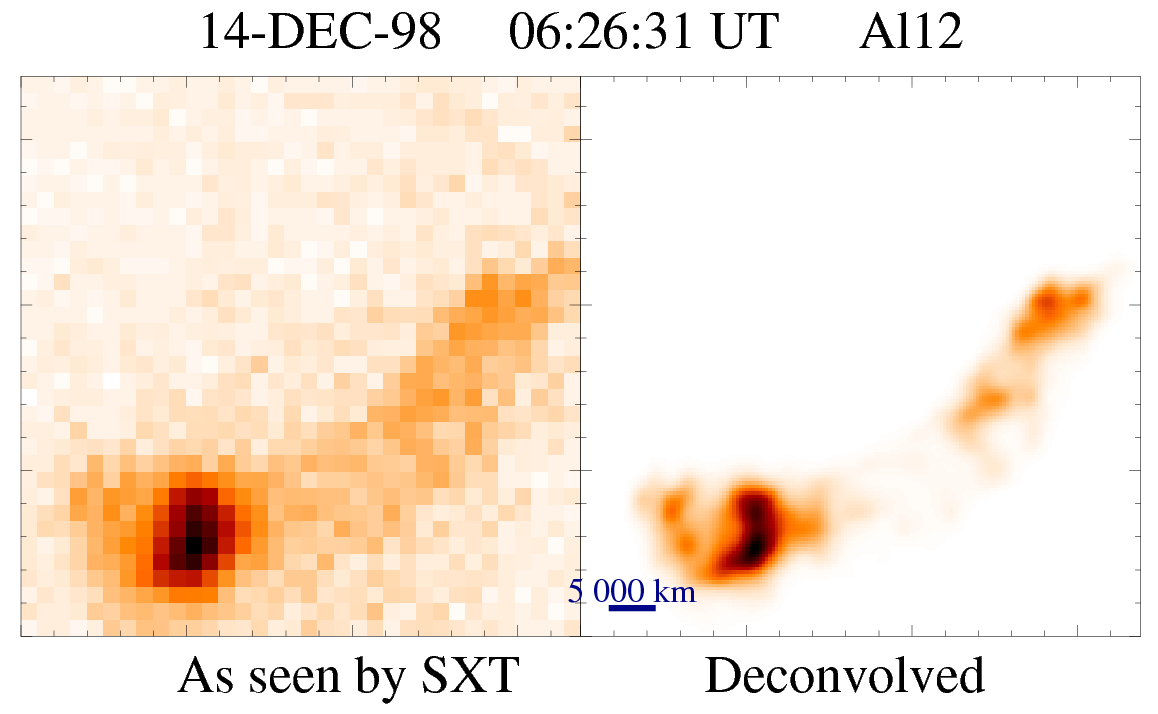
Figure 1: An example of the SXT image obtained in the Al12 filter during the rise phase of 1998 December 14 flare. The left panel corresponds to the original image and the right to the deconvolved one.
The aim of this research was to analyze the thermodynamic structure of a number of X-ray sources observed to be compact. Usually they are refereed as flare kernels. One can observe as well the top kernels as the footpoint ones (Doschek et al., 1995; Sylwester and Sylwester, 1999a). The flare kernels are the common and dominant features of the flaring regions observed in the soft and hard X-ray Yohkoh images. The soft X-ray sources seen at the top got much more attention especially as observed for the limb flares (Doschek and Feldman, 1996; Jakimiec et al., 1998). For the present research we have made the flare selection from the catalog of hard X-ray sources covering the entire duration of the Yohkoh mission (http://solar.physics.montana.edu/sato/shxtdbase.html). We have chosen flares with the most compact kernels well covered by the observations. The eight compact flares of different GOES class and duration, located as well at the limb as on the solar disk were selected. They are listed in Table 1 together with their main characteristics given. Respective sequences of the SXT images obtained in accessible X-ray filters have been deconvolved before further analysis. The deconvolution (with the oversampling, dividing the SXT pixel into 25 subpixels) has been performed using ANDRIL algorithm (Sylwester and Sylwester 1998, 1999b) available within SolarSoft. The algorithm removes the image blurring due to the instrument point spread function and increases numerically the spatial resolution down to ~ 1 arcsec. The examples of what the deconvolution does can be seen in Figure 1 where a part of SXT image as seen in Al12 filter is shown before (the left panel) and after (the right panel) the deconvolution. The color version of all Figures presented in this contribution one can find on our web side http://www.cbk.pan.wroc.pl/publications.htm. It is seen that deconvolution reveals fine details not observed on the original images and removes the background. It should be noted that during the deconvolution the total flux in the image is preserved. Following the deconvolution the images were carefully coaligned, making use of the spacecraft pointing data files and additional cross correlation algorithm. This allowed us to study the structure (the morphology), dynamics and thermodynamic parameters of individual kernels using the filter ratio technique. Using this technique we inferred maps of distribution of basic thermodynamic characteristics (temperature T and density N). Where possible respective HXT observations were incorporated into the analysis. The HXT images have been reconstructed using standard maximum entropy method (MEM). They have been used to overlay the location of harder X-ray components onto the softer emission patterns from SXT.
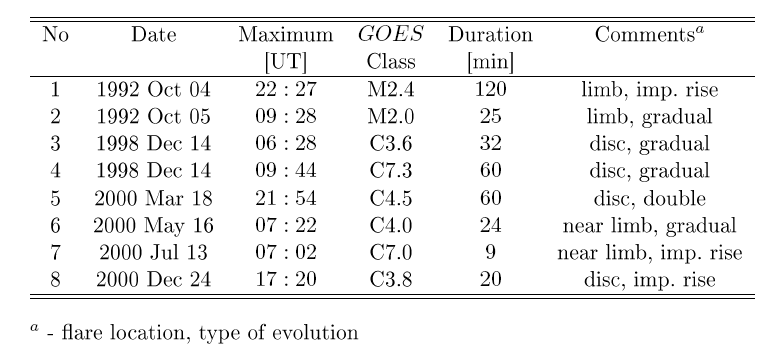
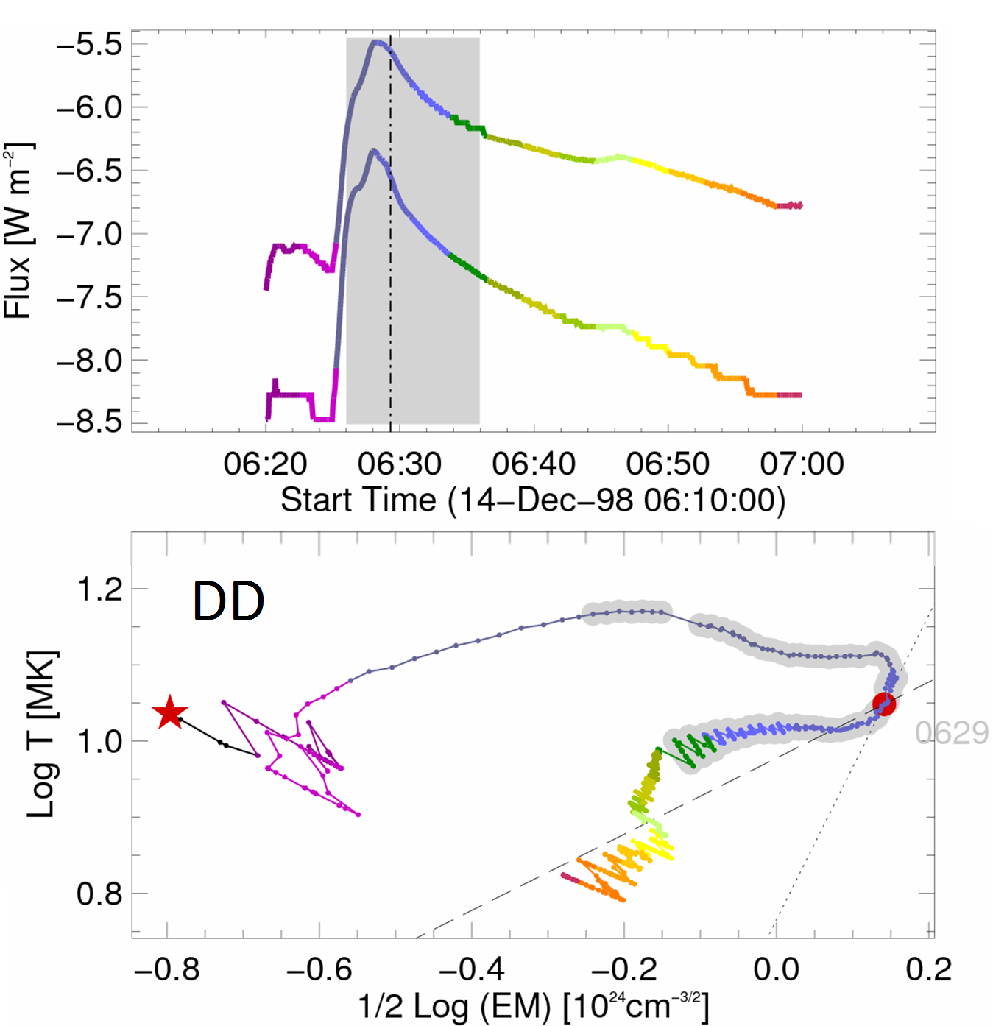
Figure 2: The evolution of flare on 1998 December 14 as seen in the soft X-ray radiation. At the top GOES lightcurves are presented with the shaded box indicating time interval corresponding to the SXT observations. The vertical dashed line indicates the time shown as a full circle in DD below. The diagnostic diagram ( DD) is presented as a track joining points separated each 3 s from cleaned GOES data. The star denotes the beginning of the time period studied and the full dot corresponds to the time when the vertical dashed line in the upper GOES lightcurve is placed. The grey shades around the observing points on DD show the time when SXT images were available.
|
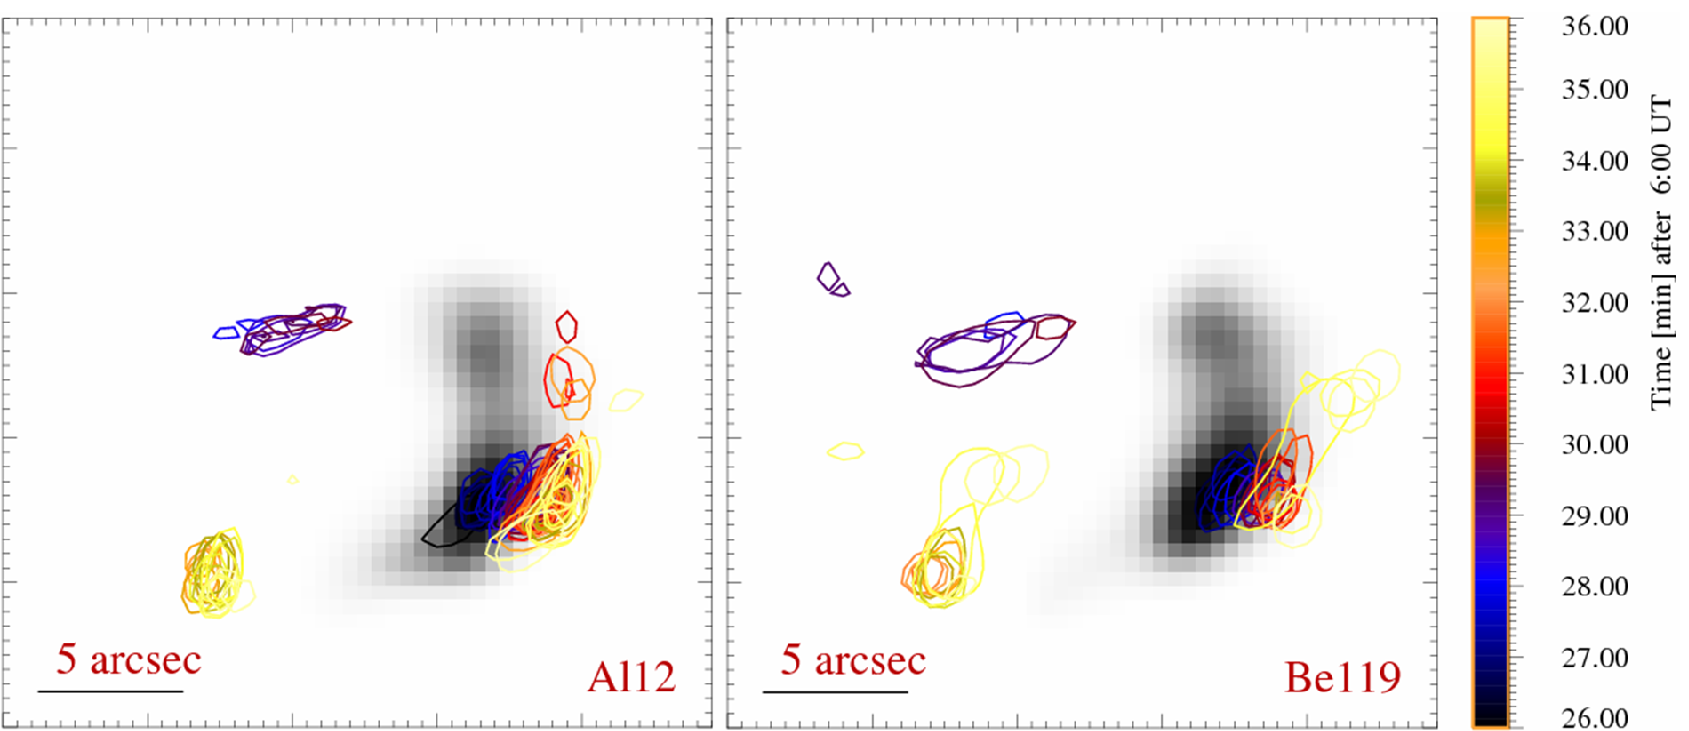
Figure 3: The displacement of the brightest plasma components as seen on SXT Al12 (left) and Be119 (right) images for the flare on 1998 December 14. The sequence of contours is drawn at the level of 0.8 maximum intensity for consecutive frames. The first available non-saturated images are displayed in grey shades at the background.
An inspection of the deconvolved SXT images reveals that the flare which has been selected as equipped with a compact kernel, shows its morphology to be changing during the evolution. After the deconvolution it was no longer seen as one source, but consisted rather with a number of emitting patches.
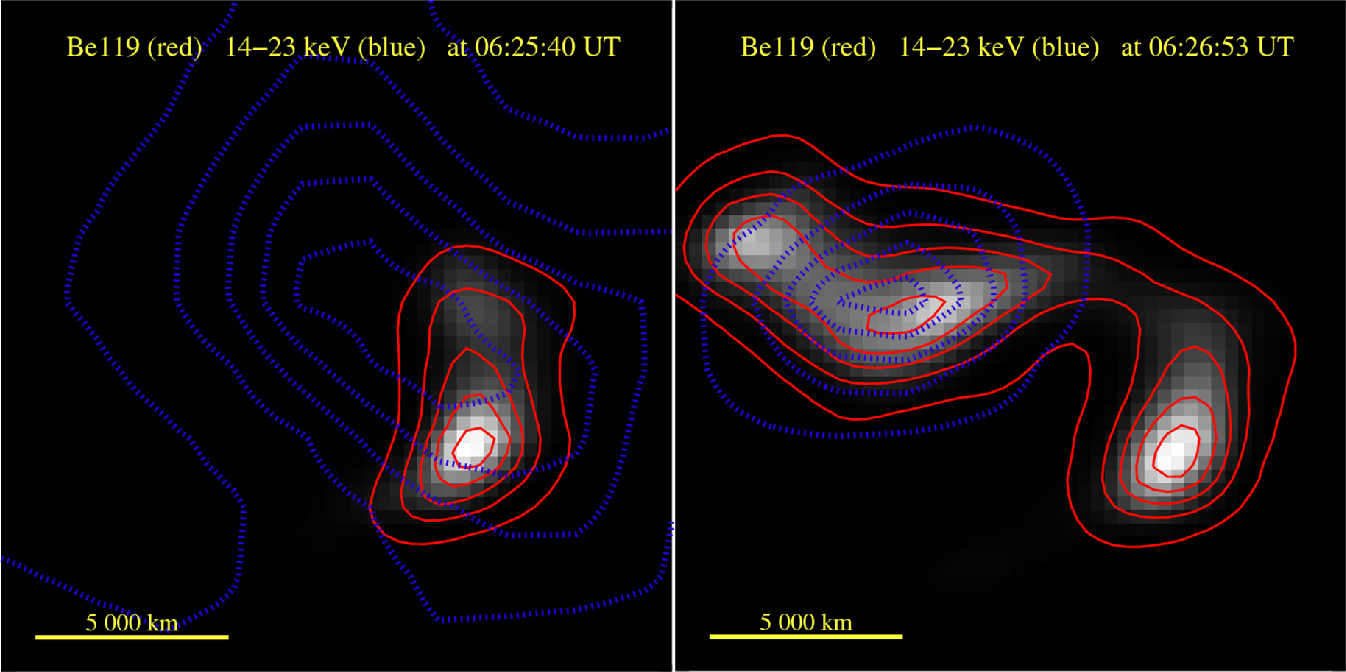
Figure 4: A comparison of the soft and hard X-ray emission locations for the two times of 1998 December 14 flare evolution separated by ~ 2 min. The images at the background and the solid (red) contours correspond to Be119 emission while contours of the HXT emission seen in the LO channel (14 - 23 keV) are drawn as dotted (blue) lines.
In Figure 3 we present the locations of bright plasma emission as seen in deconvolved Al12 and Be119 images for about 10 min of flare evolution. We plotted the contours drawn at 0.8 of the maximum intensity on each image in the sequence. As the background, the intensity pattern for the first in the sequence image is shown for the comparison. The rise time contours are drawn black and their shades become lighter towards the decay. It is striking how well the pattern coincides between the two Al12 and Be119 energy bands selected. After some
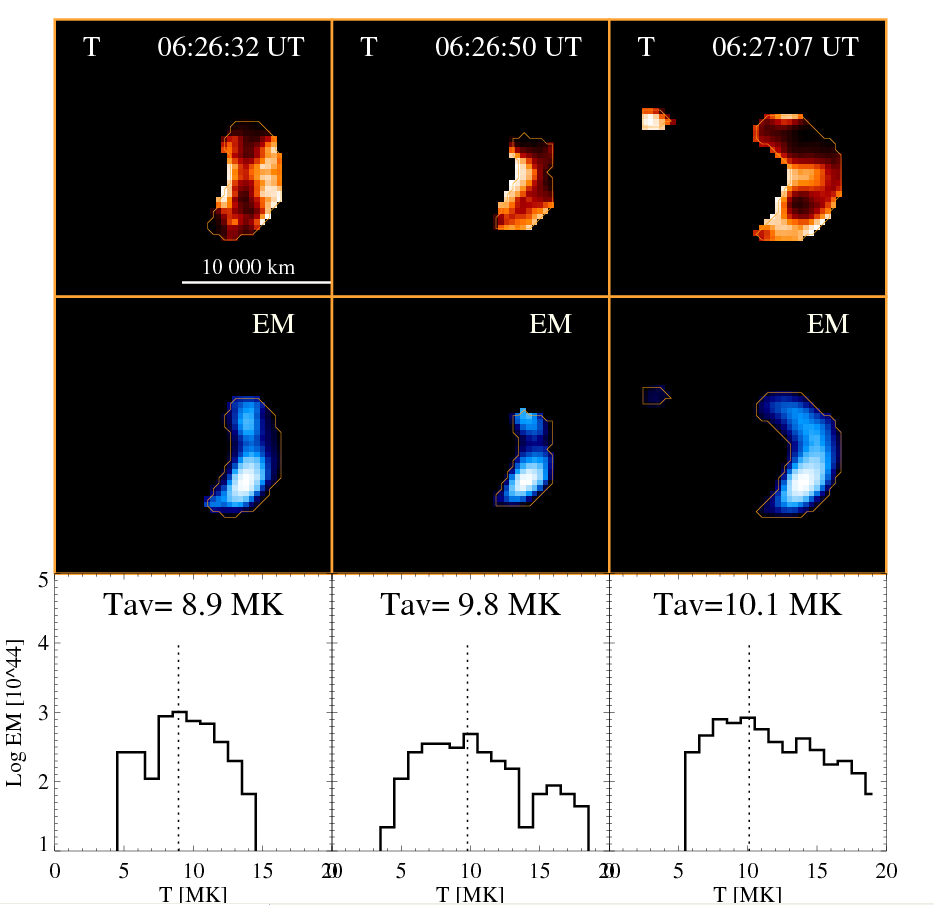
Figure 5: The distribution of main thermodynamic parameters for three times on the rise phase (see respective columns) during 1998 December 14 flare. The "isothermal'' temperature and emission measure are presented in false shades in the first and second row respectively. The thin white line delimits a common region for Al12 and Be119 images where there is sufficient signal (above 50 DN/subpixel) allowing for a meaningful interpretation. The size of presented images is 50 subpixels. The bottom row shows corresponding histogram of qDEM. See the text for explanation.
time the first emission patch is being replaced by the other in dominating the X-ray emission. The two patches are separated by ~ 10 arcsec. A systematic pattern of displacements of kernels' brightness location is observed in all SXT channels shown here and for the others flares studied. The transversal displacements are evidently more pronounced for the limb flares. In those cases the maximum of X -ray emission changes its position, suggesting the motion of the source outward of the Sun.
In Figure 4 we compare the soft and hard X-ray brightest area locations for two moments during the rise phase of analysed flare as seen on SXT (deconvolved) and HXT (MEM reconstructed) images. In about one minute, the pattern of X-ray emission changed substantially. The additional (double) soft X-ray emitting source has been formed about 7500 km apart from the main emissivity patch which can be also traced in Figure 3. A hard X-ray emission source became more compact and centered at the position of the additional, fainter soft X-ray patch. This illustrates a fast rearrangement of the softer and harder X-ray emissivity pattern. As the plasma is confined into the kernel by the magnetic field this is an evidence of respective solar magnetic field rearrangement. As concerns the filter ratio analysis of deconvolved soft X-ray images, of crucial importance is precise relative coalignment of the images obtained in different filters. A special coalignment correlation technique has been used in this respect which allowed for ~ 0.1 arcsec accuracy. The filter ratio technique provides the estimates of the temperature and emission measure in each subpixel (0.5×0.5 arcsec). The results are presented in the two top rows of Figure 5 for three times (columns) during the rise phase separated by about 17 sec. The fine structure of the T and EM distributions can be seen within the kernels. The hottest places (the lighter areas in the upper row) are not necessarily the densest ones (the middle row). In this and many other events an apparent "anticorrelation'' exists: the more rarefied regions are hotter then the denser and more luminous parts of the X-rays kernels. In this, and many other times and events, the centers of the kernels are cooler and the edges of kernels are seen to be hotter. This is not the instrumental effect. This observed property indicates that the energy release is the most efficient at the kernels boundaries.
At the bottom row of Figure 5 we present a corresponding "quasi'' differential emission measure distribution (qDEM) constructed based on the temperature and emission measure maps (see Sylwester and Sylwester, 2002). The qDEM histograms have been constructed as follows: at first the subpixels have been identified with the temperature falling into the (T, T+D T) range and next the emission measure for all those subpixels have been summed together and put at the histogram for appropriate temperature. The averaged temperatures of the entire region occupied by the kernels are indicated in the Figure. It is seen that the bulk of the plasma is characterised by the relatively high temperature component seen around T ~ 10 MK. The corresponding plasma densities determined with the assumption of the uniform filling are: 1.9, 2.5 and 1.7 x 1011 cm-3 respectively for the three times presented in Figure 5. It is also seen that for selected confined region there exists a small amount of very hot plasma (T>15 MK), with growing importance of this component as the flare's flux rises. The absence of cooler plasma (with T<5 MK) in the histogram is a selection effect connected with the fact, that using Al12 and Be119 filters the plasma with temperatures higher than 5 MK is preferentially "seen'' through a combination of plasma emissivity and the filter energy response.
The results obtained confirm a crucial role the plasma kernels play in the formation of coronal X-ray radiation. Kernel plasma properties are best revealed through the interpretation of spectral measurements, therefore such a study will be undertaken soon, based on analysis of high resolution spectra obtained from the RESIK spectrometer. A good foundation for such analysis is presented by Phillips et al., (2006).