![]()
RESIK & Diogeness NEWS
|
|
(Week 19, 2003, 05 May - 11 May)
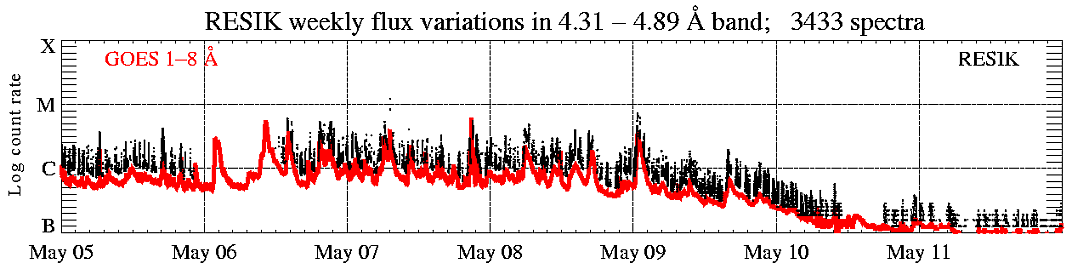
In the display above (click to enlarge), the solar X-ray fluence seen by RESIK (black points) is plotted atop GOES red line. Only periods with good spectral measurements are indicated. The total number of good spectral measurements is given in the title line.
|
Operation mode: |
1 s DGI has been used '3rd order reflections' (ORD3) is
used as stand-by mode.
|
|
|
Calibrations made: |
No calibrations made
| |
|
ADS Settings: |
| |
|
| ||
| (ORD1) HV: Det. A - 1480 V, Det. B - 1419 V. | (ORD3) HV: Det. A - 1389 V, Det. B - 1328 V. | ||||||
|
Channel |
l Band |
ADS |
Channel |
l Band |
ADS | ||
| #1 | #2 | 3.37 - 3.88 Å | 115 - 195 | #1 | #2 | 1.16 - 1.29 Å | 110 - 230 |
| #2 | #0 | 3.82 - 4.33 Å | 75 - 170 | #2 | #0 | 1.27 - 1.44 Å | 110 - 230 |
| #3 | #3 | 4.31 - 4.89 Å | 170 - 250 | #3 | #3 | 1.44 - 1.63 Å | 110 - 230 |
| #4 | #1 | 4.96 - 6.09 Å | 145 - 205 | #4 | #1 | 1.65 - 2.03 Å | 140 - 230 |
|
|
| ||||||
Data gaps due to missing/bad telemetry: ~ 23.5 h.
Note, that the link to the catalogue page is now: http://www.cbk.pan.wroc.pl/resik_catalogue.htm.
On Possible Chlorine Lines Seen by RESIK
The four RESIK channels cover the spectral range from 3.37 Å to 6.09 Å (for details see Weekly 40, 2002). In spite of many known and commonly observed X-ray lines in this range corresponding to the transitions in H- and He-like ions of various elements (K, Ar, S, Si) there are some spectral features seen which identification is missing. In an attempt to perform their tentative identification we have synthesized a number of spectra to be seen in the four RESIK channels. We have used CHIANTI code and calculated the spectra assuming a number of (regarded typical) values of plasma parameters. In the following step these synthesized spectra have been compared with the observed ones. In the comparison we have adjusted the dispersion (cf. Weekly 17, 2003) and aligned the synthetic spectra in every channel based on the fixed wavelengths of the strongest lines of known origin. It turned out that some of lines observed by RESIK are not present in the synthetic spectrum. We have made the search in the literature trying to find supplementary theoretical wavelength calculations and laboratory measurements of the lines corresponding to the observed unknown spectral features.
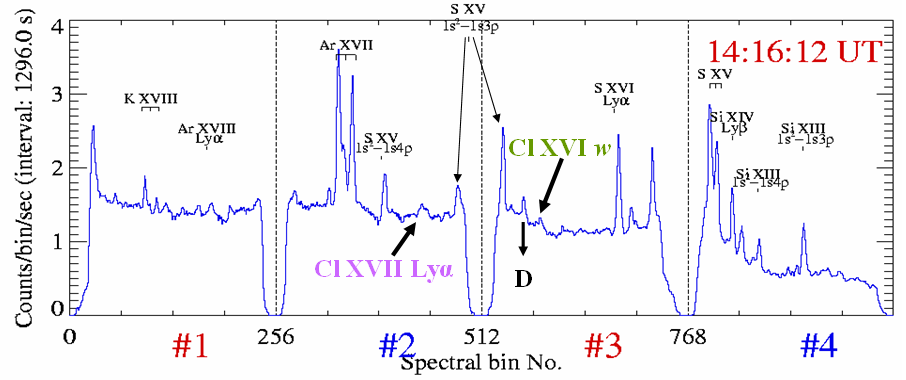
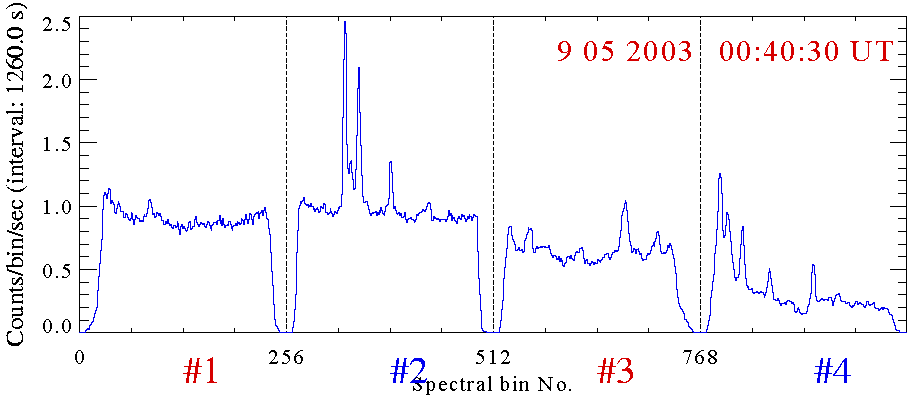
Figure 1. The spectrum has been integrated over ~21 min. covering the rise, maximum and decay phases of a small disc (S09E27) flare of C 7.2 class. The flare took place on 11th December 2002 with the maximum recorded at 14:10 UT. Parts of the S XV 1s2-1s3p line profile are seen as well in channel #2 as in #3.
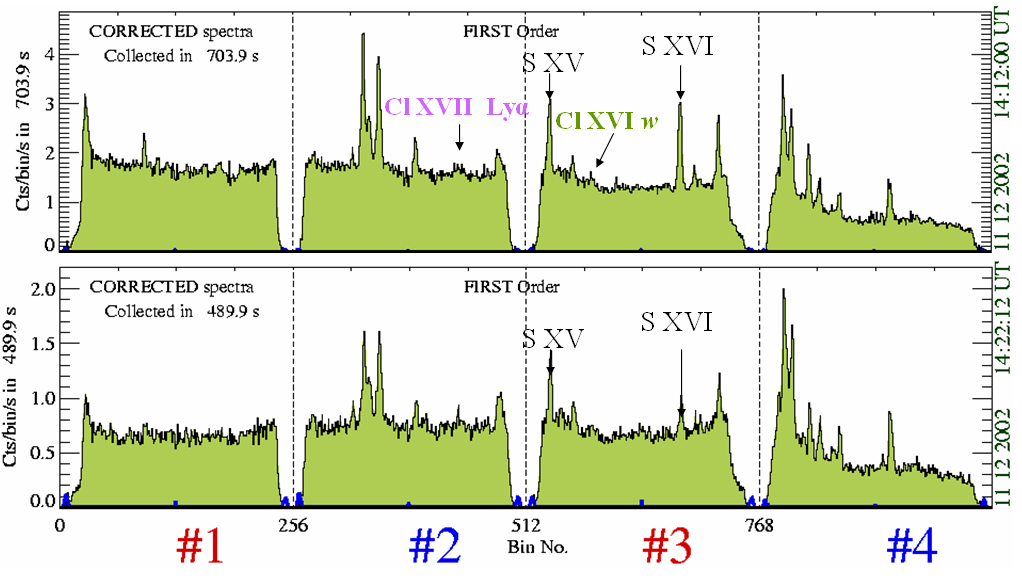
Figure 2. The spectra for the same flare (11 Dec. 2002) but integrated individually over ~12 min during the rise and maximum and over ~8 min during the decay. One can see the change of relative intensities of many lines. In particular, in channel #3 during the rise phase (and the maximum) the S XVI Lya line is the strongest while during the decay the S XV 1s2 -1s3p takes over.
The most useful papers in this respect turned out to be Phillips and Keenan (MNRAS, 245, 4p, 1990) and Boiko et al. (MNRAS, 185, 789, 1978). In the first paper the authors analysed the X-ray observations made with the Flat Crystal Spectrometer (FCS) aboard the Solar Maximum Mission during a large flare. They made identification of the weak feature seen at 4.443 Å as the resonance line (1s2 1S0 1s2p 1P1) of He-like chlorine (Cl XVI). Boiko et al. provide the relativistic calculations of the entire satellite line structures in the vicinity of (1s2 1S0 1s3p 1P1) line for elements with atomic number Z = 12 ÷ 19 and compare the calculated spectra with those observed in the laboratory from the laser produced plasma.
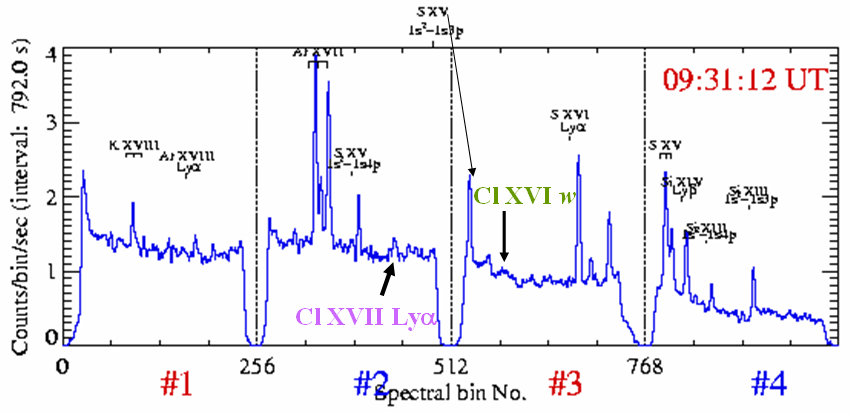
Figure 3. Another illustration presenting the spectrum with a noticeable chlorine line emission seen. This spectrum has been integrated over the entire short (~13 min.) flare of C5.8 class on 22 Feb. 2003. The flare has been observed near the disc center (N16W05) with the maximum around 09:29:00 UT.
Among the unknown spectral features seen on RESIK channel #3 spectra one corresponds (based on wavelength coincidence) with the Cl XVI line (see Figure 1). Towards the shorter wavelengths of this line, in the channel #3 RESIK sees sometimes (when flare is at proper location) stronger spectral features. These correspond to the (1s2 1S0 1s3p 1P1) transition in He-like S XV ion. As a kind of supporting evidence for such identification is that the expected group of satellite lines (with the strongest denoted as D at 4.3882 Å by Boiko et al.) corresponds to the respective spectral enhancement observed by RESIK on the long-wavelength shoulder of this S XV line (indicated in Figure 1).
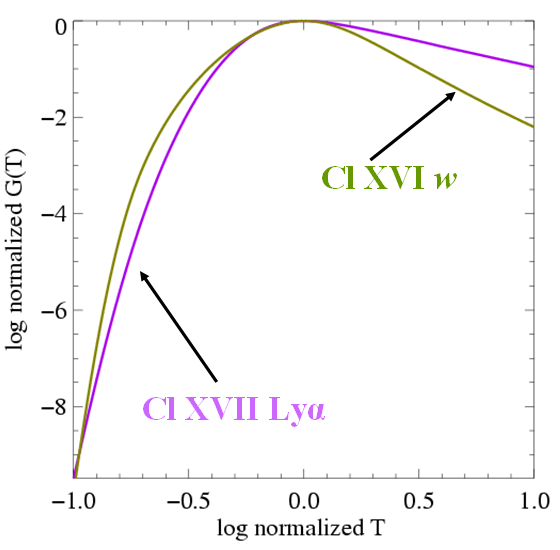
Figure 4. The emission functions of H- and He-like chlorine resonance lines. The functions are normalized to their maxima and plotted against the reduced temperature (the ratio of actual temperature over the temperature Tm of the maximum of emission function in the line). The Tm used are 28.8 MK and 18.6 MK for H- and He-like lines respectively.
As the plasma temperature appears to be high during the collection of the spectrum presented in Figure 1, it is expected that besides the Cl XVI resonance line, the resonance line originating in H-like Cl XVII should be also seen at the wavelength of 4.18 Å. This exactly corresponds to the bin where the unidentified line is observed in channel #2 (compare Figure 1 and Weekly 40, 2002 the line with the "?"). Therefore, we conclude that this feature corresponds to the Lya line of the H-like chlorine ion (Cl XVII). This Lya should be blended with the group of satellite lines to 1s2 1s4p of S XV line (4.0885 Å). Using the observations of chlorine line intensities it would be possible to estimate the coronal chlorine abundance. This in turn is of great importance in the continuing debate on the dependence of abundance on FIP (12.967 eV for Cl) of the element. We have made the interpolation of the emission (contribution) function for these two chlorine lines of interest. The interpolation is based on tables of Mewe, Gronenschild and Oord, A&AS, 62, 197, 1985.
Prepared by: Marek Siarkowski ms@cbk.pan.wroc.pl, Barbara Sylwester bs@cbk.pan.wroc.pl, Anna Kepa ak@cbk.pan.wroc.pl and Janusz Sylwester js@cbk.pan.wroc.pl
The report presented has been done in "real time" and so it may contain jargon, blunders, or trivialities. We do not have also an English native speaker in our Wroclaw group!
We would be happy to discuss problems mentioned above in more details if necessary.
RESIK data are in the open public domain and can be requested from: http://surfwww.mssl.ucl.ac.uk/surf/data_request.html.
Previous RESIK_weekly notes are in the archive: http://www.cbk.pan.wroc.pl/resik_archive.htm
Page made on 16 May 2003 by: Anna Kepa ak@cbk.pan.wroc.pl and Jarek Bakala jb@cbk.pan.wroc.pl